Figure 1.

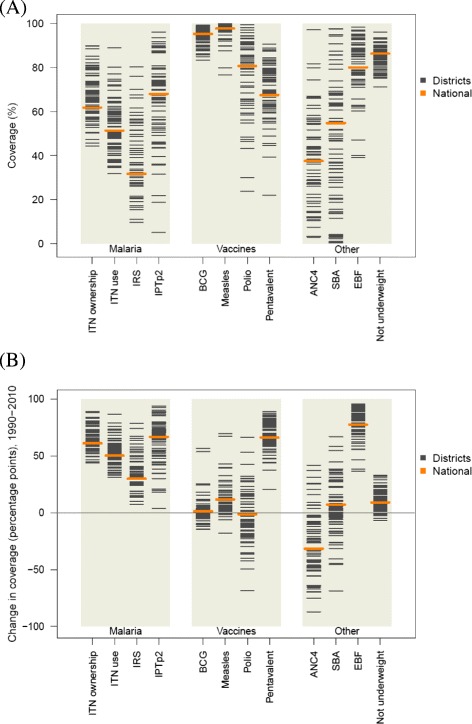
Distribution of intervention coverage in 2010 (A) and absolute change in coverage from 1990 to 2010 among districts (B). IRS displayed only for targeted districts in 2010.

Distribution of intervention coverage in 2010 (A) and absolute change in coverage from 1990 to 2010 among districts (B). IRS displayed only for targeted districts in 2010.