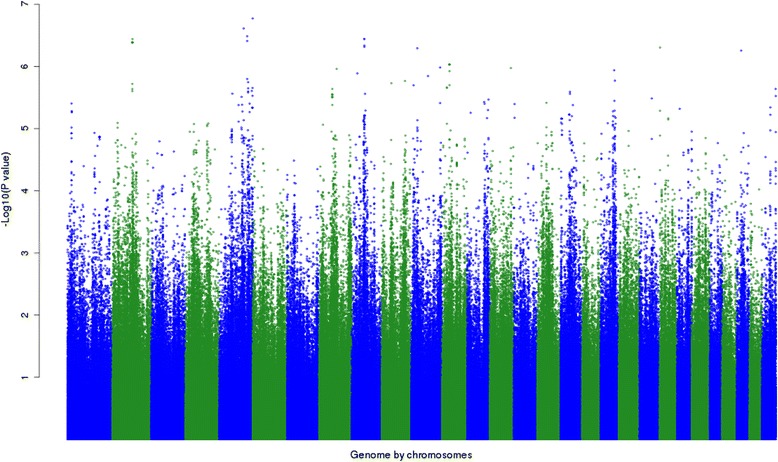
Figure 2.

Manhattan plot showing the –log 10 ( P -values) of pair-wise epistatic effects for post-weaning live weight (PW_lwt) between lead SNP (BovineHD1400007259 at position 25015640 on BTA 14) and SNPs across the genome, except SNPs on the X chromosome.
