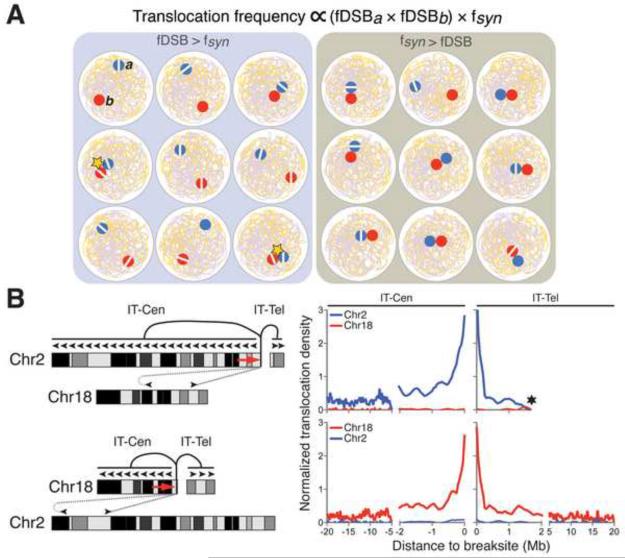
Figure 4. Pre-existing Spatial Organization of the Genome Influences Translocations.
A) Cellular heterogeneity of spatial genome organization allows frequent DSBs to drive recurrent translocations. Two genomic loci (a, b) on heterologous chromosomes are illustrated as red and blue circles; white lines within them indicate DSBs; stars indicate translocations. fDSB indicates frequency of available DSBs at a given site; fsyn represents frequency of cells in the population in which two DSBs are physically juxtaposed. Comparison of left and right panels illustrates that frequent DSBs can drive recurrent translocations of two sequences that are, on average, not the most proximal in a population. B) Pre-existing spatial proximity markedly influences translocation frequency in the absence of dominant DSBs. Left, schematic of two experimental examples (Zhang et al., 2012) illustrates that a targeted DSB (gap after red arrowhead) in a given chromosome translocates much more frequently along the same chromosome than to other chromosomes. Right, translocation frequencies from a DSB on a given chromosome in ATM-deficient, IR-treated, and G1-arrested transformed pro-B lines are highest to sequences very proximal to the DSB. The curves are based on actual data (from Zhang et al., 2012), shown in schematic form on the left panel, and represent inversional cis translocations from the DSB site, with primer orientation indicated by red arrowhead on chromosome ideogram. Inversional translocations (IT) clearly involve joining of two DSBs in this assay and, thus, are distinguishable from resections that also contribute substantially to breaksite-proximal junctions (Chiarle et al., 2012). Black * indicates end of Chr.2. Mb, megabases. Cen and Tel refer to “centromeric” and “telomeric” relative to the DSB. See text for more details.

