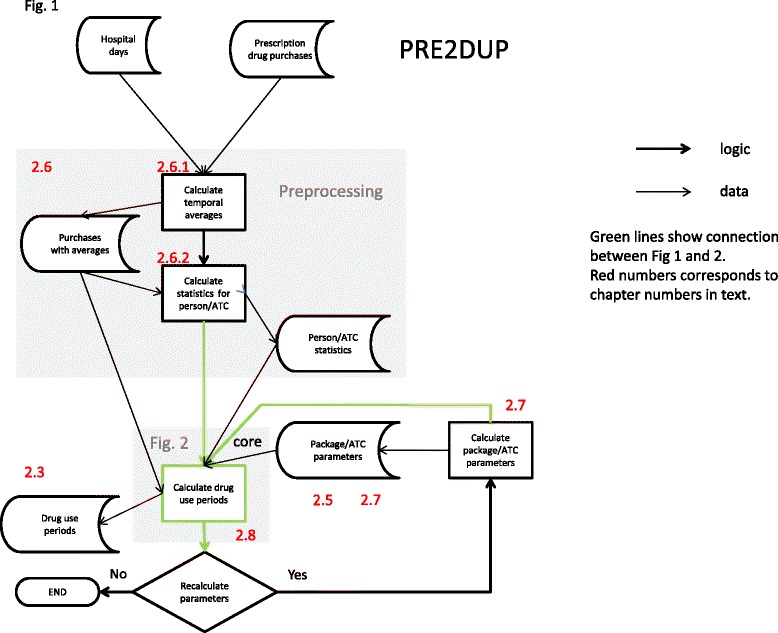
Figure 1.

The overall operation of PRE2DUP. Data is first preprocessed, and then drug use periods are calculated. New parameters are calculated iteratively, to improve the results. Green arrows show the work-flow around the core process. Red numbers link to particular sections in the text.
