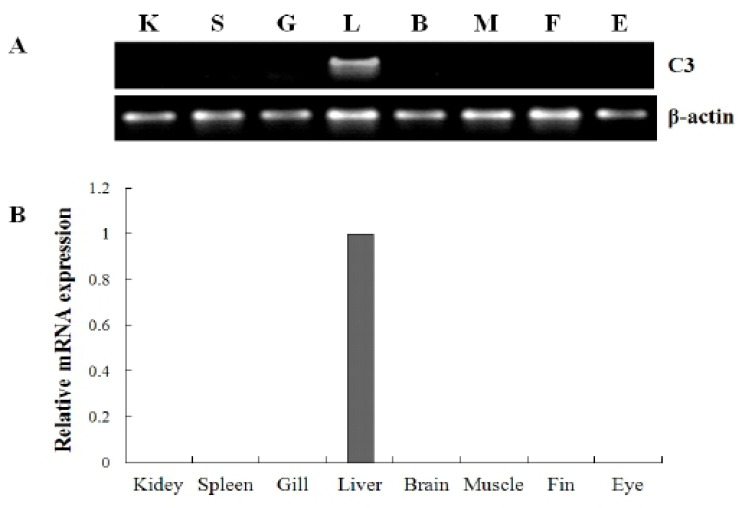
Fig. 2.
Normal tissue distribution of complement component C3 mRNA in various tissues. (A) Tissue distribution of the C3 mRNA was subjected to RT-PCR analysis using 2 year-old healthy olive flounder. (B) A quantitative real-time PCR analysis was performed with equal amounts of total RNA from the tissues of healthy olive flounders. β-actin was used as an internal control. K, Kidney; S, Spleen; G, Gill; L, Liver; B, Brain; M, Muscle; F, Fin; E, Eye.

