Fig. 2.
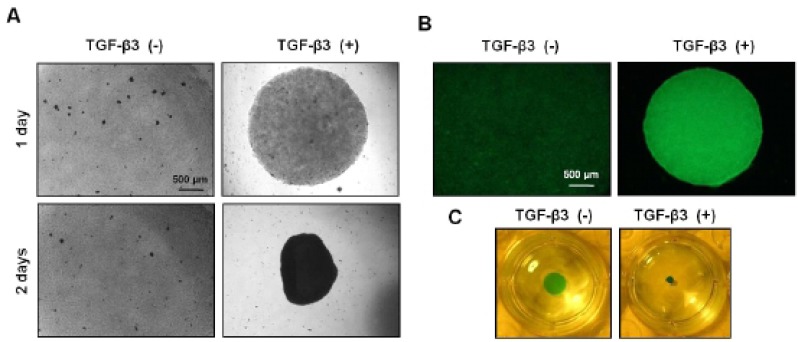
Chondevrepogenic differentiation of hMSCs in a micromass culture. (A) Pictures of differentiating hMSC aggregates from micromass culture. Bar: 500 μm. (B) PNA staining of cultures treated with TGF-β3 demonstrates a change in cellular condensation. Bar: 500 μm. (C) MSCs were cultured as micromass and treated with TGF-β3 (10 ng/ml). Cultures were stained with Alcian blue after two days.

