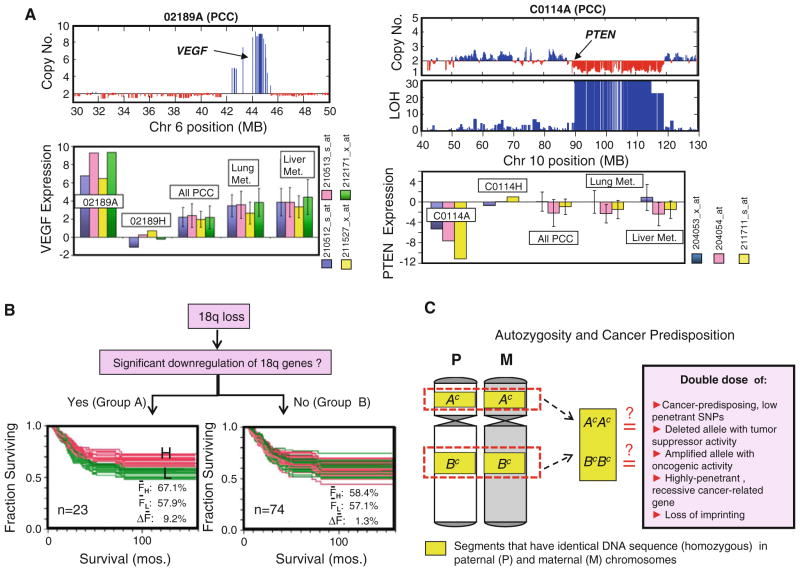
FIG. 1.
a SNP array analysis (Affymetrix 50 K Xba) reveals a highly amplified region in the 6p arm (which includes VEGF locus) and a deleted region in the 10q arm (which includes PTEN locus) of primary colon cancer (PCC) samples 02189A and C0114A, respectively. Genome-wide expression analysis (Affymetrix U133A) indicates that 02189A had a very highly upregulated expression of VEGF (as detected by all 4 probe sets), and C0114A had highly downregulated PTEN (3 probe sets), compared with their matching normal mucosa samples (02189H, C0114H), the rest of PCC samples (n = 182), liver metastasis samples (n = 39), and lung metastasis samples (n = 19). Gene expression level is calculated as: zt = (It − Īn)/σn; where It is the normalized, log transformed intensity value (I) of each probe set for the tumor sample, while Īn and σn are the average and standard deviation (respectively) of the I values for 53 normal mucosa samples. b The loss of 18q occurs often in CRC and has been linked to poorer prognosis. Genes within the 18q arm are arbitrarily divided into 2 groups. Group A genes (n = 23) are those with significant expression downregulation, i.e., zt ≤ −3 in at least 10% of PCC samples run in both SNP and expression arrays (n = 71), while the rest of the genes (n = 74) outside this category are classified into group B. CRC patients with expression data for PCC samples are divided into low expression group (L, green) and high expression group (H, red) for every 18q gene, prior to Kaplan–Meir (KM) analysis. Noticeable is the distinct H/L clustering pattern in the overlaid KM plots of Group A (but not in Group B) genes, suggesting that lower expression level of a number of genes (attributed to 18q loss) also correlates to poorer prognosis. The ΔF values (FH – FL; where FH and FL are the 5-year survival rates for H and L patient groups, respectively) are significantly higher in A gene group compared to B gene group (t test, P<0.001). c Possible explanations on why autozygosity contributes to cancer predisposition

