FIGURE 1.

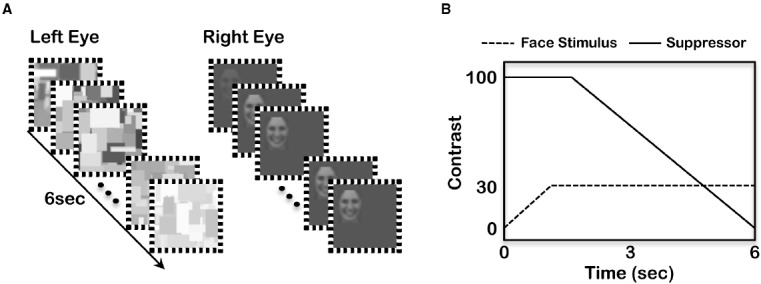
(A) Schematic diagram of stimulus presentation. (B) Changes in the contrast of the suppressor (solid line) and the face stimulus (dashed line).

(A) Schematic diagram of stimulus presentation. (B) Changes in the contrast of the suppressor (solid line) and the face stimulus (dashed line).