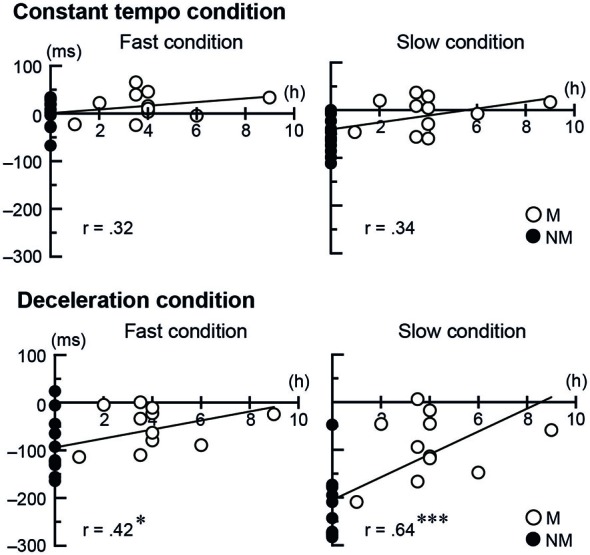
Figure 4.

The scatter plots of each participant’s temporal asynchrony under the conductor conditions and the frequency of playing music with a conductor per week. The single and triple asterisks represent p < 0.05 and < 0.001, respectively. The abbreviations mean: M = musicians, NM = nonmusicians.
