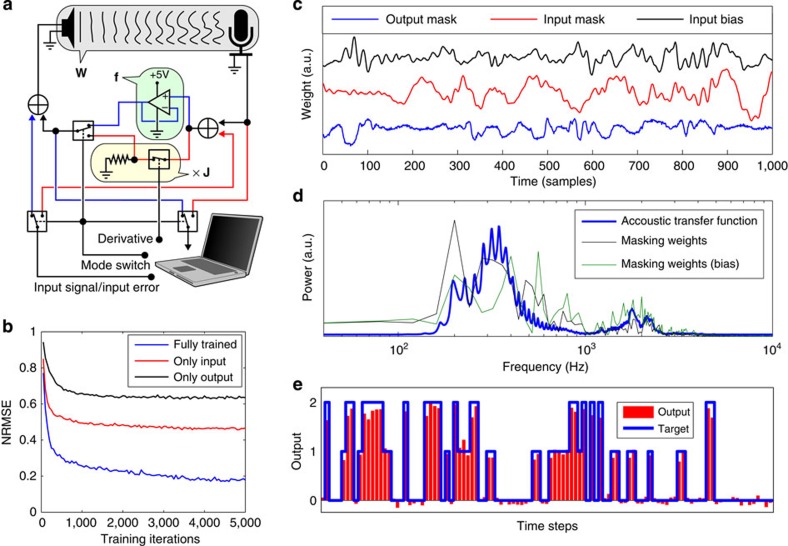
Figure 2. Results of the acoustic backpropagation experiment.
(a) Schematic depiction of the electric circuit of the experiment. The grey box at the top represents the speaker, tube and microphone. The blue circuit lines are only in use during the forward propagation and the red lines are in use during the backpropagation phase. The forward or backward mode can be toggled by a logic signal that comes from the PC, and which controls three analogue switches in the circuit. In the forward mode, the nonlinear feedback is implemented by an op-amp voltage follower which cuts off the signal at 0 V (green box), implementing a linear rectifier function. In the backprop mode, the multiplication with the Jacobian is implemented by a fast analogue switch that either outputs zero, or transmits the signal. (b) Example of the normalized root mean square error (NRMSE) as a function of the number of training iterations for three cases. That where both the output and input masks are trained, and those where only one of each is trained. (c) Example of resulting input, bias and output masks after training, corresponding to M(t), sb(t) (equation (6)) and U(t) (equation (7)), respectively. (d) Example power spectrums of the input masks and the power spectrum of the transmission of the speaker–tube–microphone system. (e) Example of the network output versus the target.

