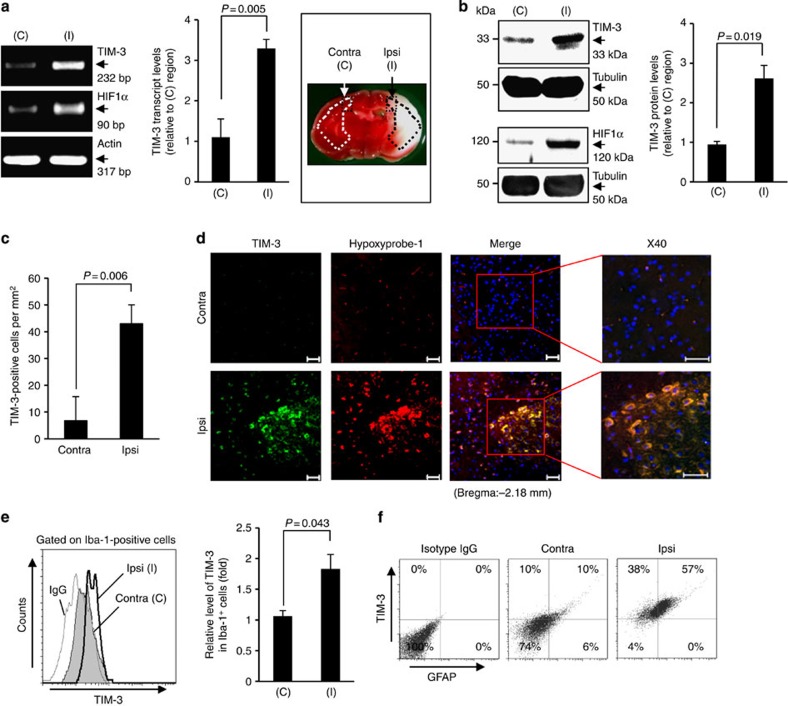
Figure 1. TIM-3 is highly expressed in hypoxic brain regions of a H/I mouse model.
(a) TIM-3 transcript levels were examined in brain tissues from the contralateral cortex (C, boxed region) and ischaemic ipsilateral cortex (I, boxed region) of mouse model 24 h after H/I. The RT–PCR products were quantified with Image J and normalized with respect to the expression of actin. The HIF-1α transcript level represents a positive control for hypoxia. The right panel shows representative TTC staining of three brain sections from the H/I mice. (b) Representative western blot analyses of the TIM-3 and HIF-1α proteins (n=3). Relative levels of TIM-3 are shown as the mean±s.d. from three independent experiments. (c) Contralateral and ipsilateral cortical regions of coronal sections from the H/I mice were subjected to immunohistochemistry using an anti-TIM-3 antibody, and the number of TIM-3-expressing cells per mm2 was counted. (d) Immunohistochemistry was performed on brain sections from the H/I mice using anti-TIM-3 and hypoxyprobe-1 (red, to detect hypoxic regions). Scale bars, 50 μm ( × 20); 50 μm ( × 40). (e,f) Brain cells were isolated from the ipsilateral and contralateral hemispheres of three mice per group, processed for simultaneous detection of TIM-3 plus Iba-1 (e) or GFAP (f), and analysed by FACS. The results are presented as relative TIM-3 levels in the indicated gated populations, as determined from three independent experiments.

