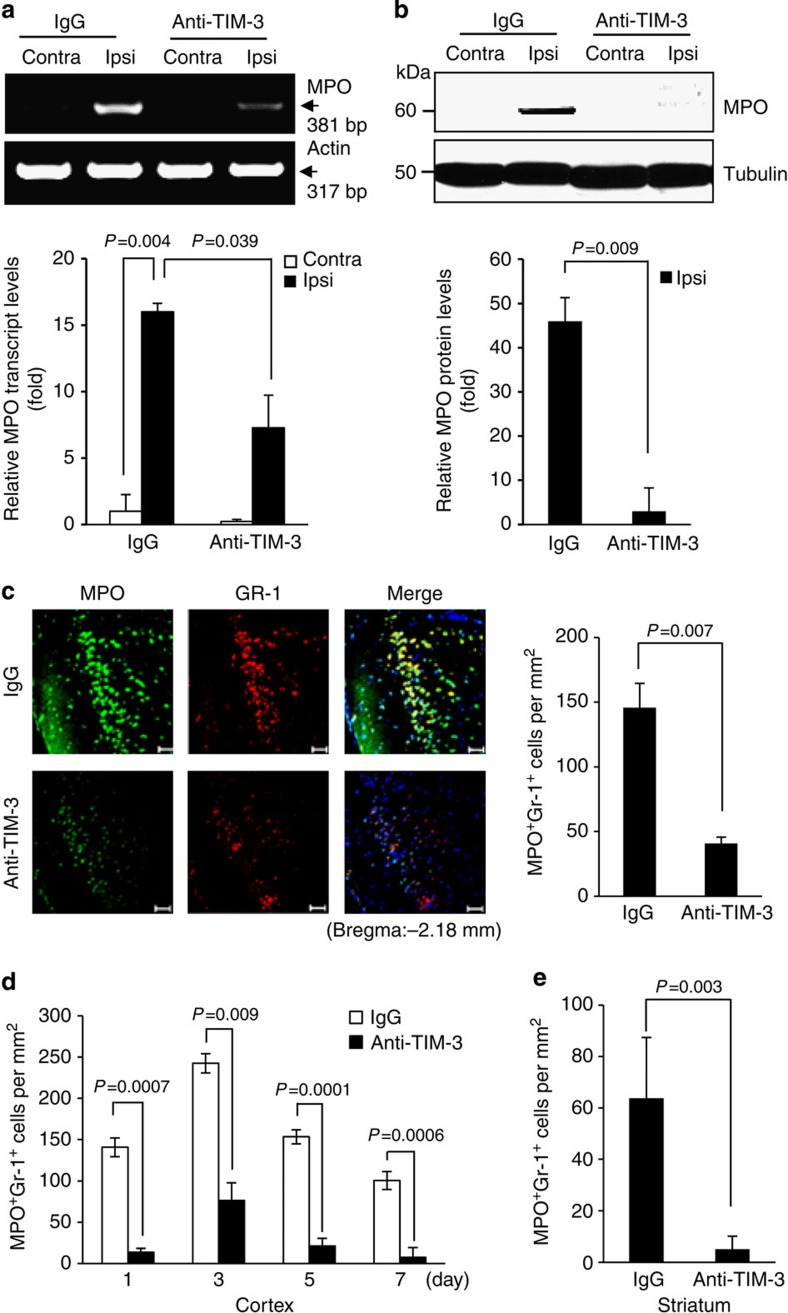
Figure 4. The TIM-3-blocking antibody reduces neutrophil migration.
RT–PCR (a) and western blot analyses (b) were used to examine MPO expression levels in the cortex tissues from control IgG- or anti-TIM-3-treated H/I mice. Graphs show the relative levels of MPO expression. (c) Immunohistochemistry was performed on coronal sections from control IgG- or TIM-3-blocking-antibody-treated H/I mice 24 h after injury using antibodies against MPO and Gr-1. Scale bar, 50 μm. The graph shows the mean number of MPO+Gr-1+ cells per mm2 (± s.d.). (d) Cortical and (e) striatum penumbral regions of coronal sections from the H/I mice were subjected to immunohistochemistry using an anti-MPO and anti-Gr-1 antibodies, and MPO- and Gr-1-positive cells per mm2 were counted.

