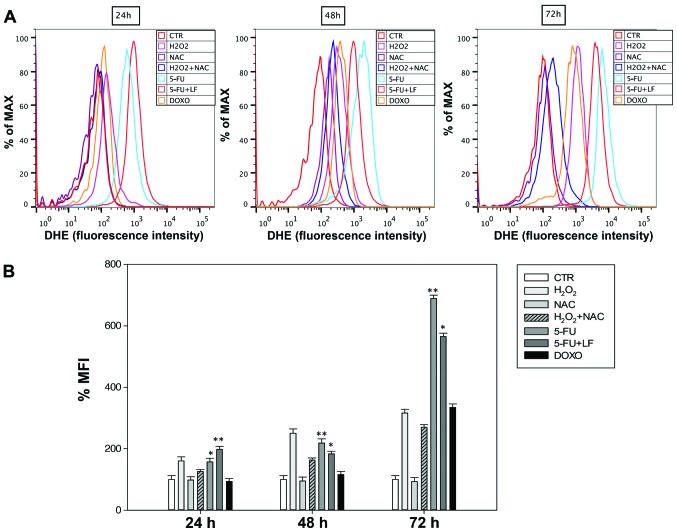
Figure 4.
Evaluation of oxidative stress in HaCaT cells treated with 5-fluorouracil (5-FU), 5-FU in combination with 10−4 M levofolene (LF) and doxorubicin (DOXO) after 24-48-72 h. (A) Flow cytometry overlay of dihydroethidium (DHE) fluorescence intensity. (B) Histogram of DHE mean fluorescence intensity (% of control). The bars represent means ± SD of three independent experiments. Asterisks indicate significant difference between 5-FU-treated vs. 5-FU+LF-treated cells (**P<0.003) and untreated vs. 5-FU-treated cells (*P<0.05).

