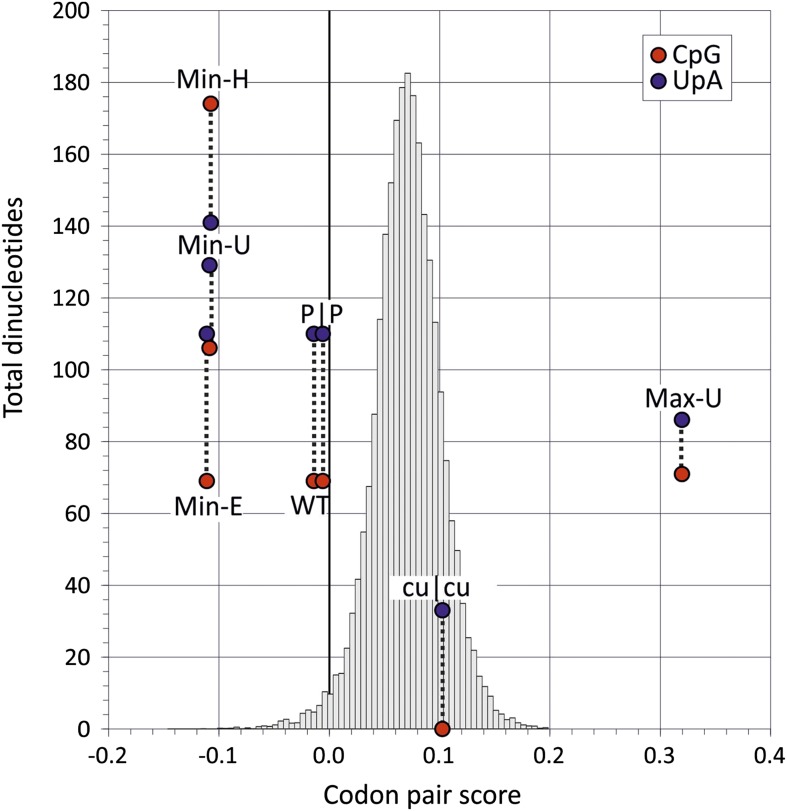
Figure 2. Codon pair scores and numbers of CpG and UpA dinucleotides in native (WT) and mutated regions of E7.
Mean CP scores for Regions 1 and 2 combined are shown on the x-axis; the total numbers of CpG and UpA dinucleotides in each sequence are shown on the y-axis. The histogram shows CP scores for the 35,170 human mRNA sequences >200 bases in length (mean 0.072; standard deviation ±0.031).

