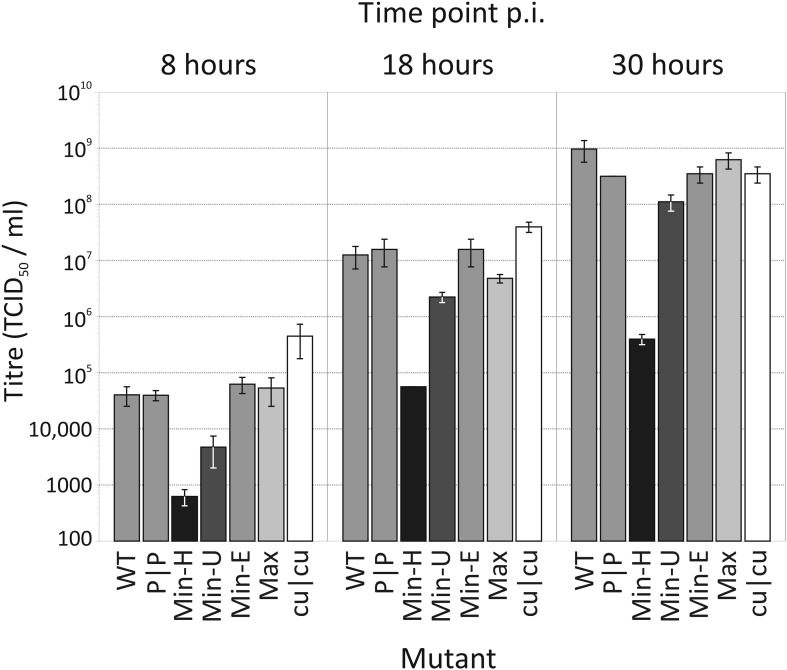
Figure 3. Replication of WT and mutants of E7 with altered CP and dinucleotide frequencies.
Bars are shaded diagrammatically based on their relative CpG/UpA composition. RD cells were infected with E7 WT, at an MOI of 0.03 and infectious titres quantified at 8, 18 and 30 hr time points post inoculation (p.i.) by TCID50 determination. Results are the mean of three biological replicates; error bars show standard errors of the mean.

