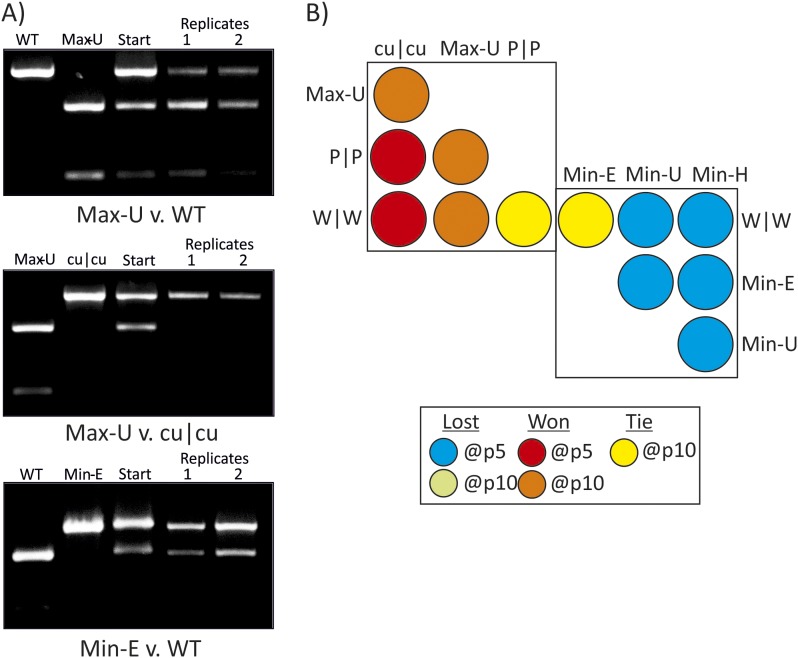
Figure 4. RD cells were co-infected with pairs of WT (W|W) and E7 mutants at equal MOI and the supernatant serially passaged through cells after development of CPE. RNA was isolated and the composition of each virus determined through selective restriction digests using enzymes listed in Table 3.
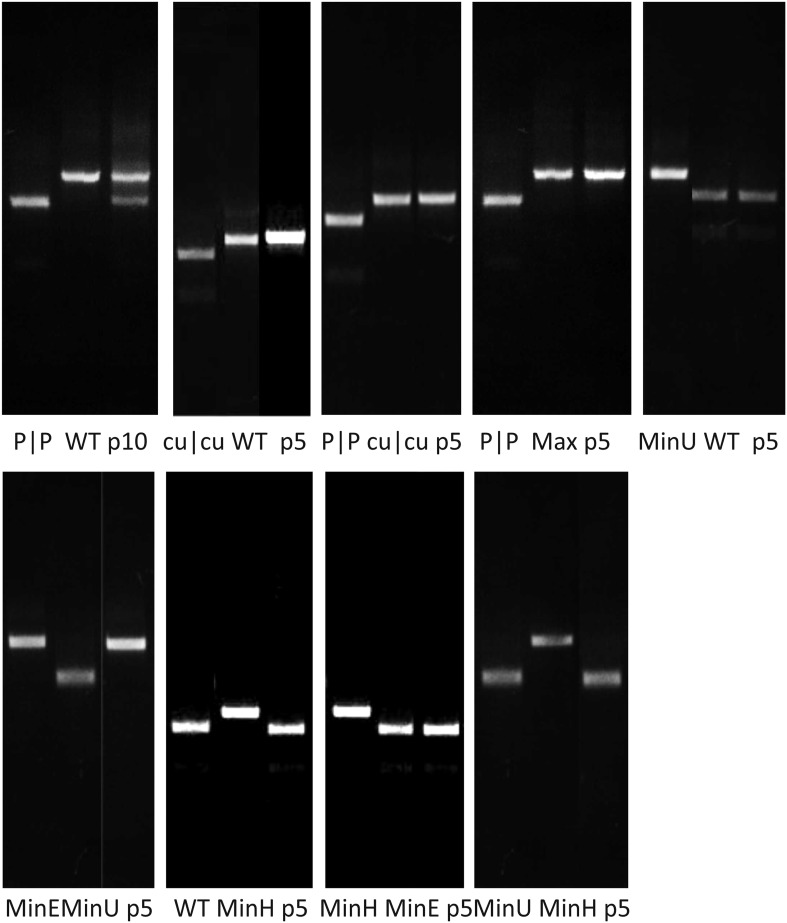
(A) Examples of three competition assays showing cleavage patterns of individual viruses (lanes 1, 2), the starting inoculum (lane 3) and two biological replicates after 10 (panels 1, 2) or 5 (panel 3) passages in lanes 4 and 5. Results from the other competition assays are shown in Figure 4—figure supplement 1. (B) Summary of pairwise fitness comparisons of viruses with outcomes for the viruses listed in columns at passages 5 and 10 indicated by colour shading. For example, Min-E and WT showed equal fitness (yellow shading) and cu|cu outcompeted WT by passage 5 (red) and Max-U by passage 10.


