. 2014 Dec 9;3:e04601. doi: 10.7554/eLife.04601

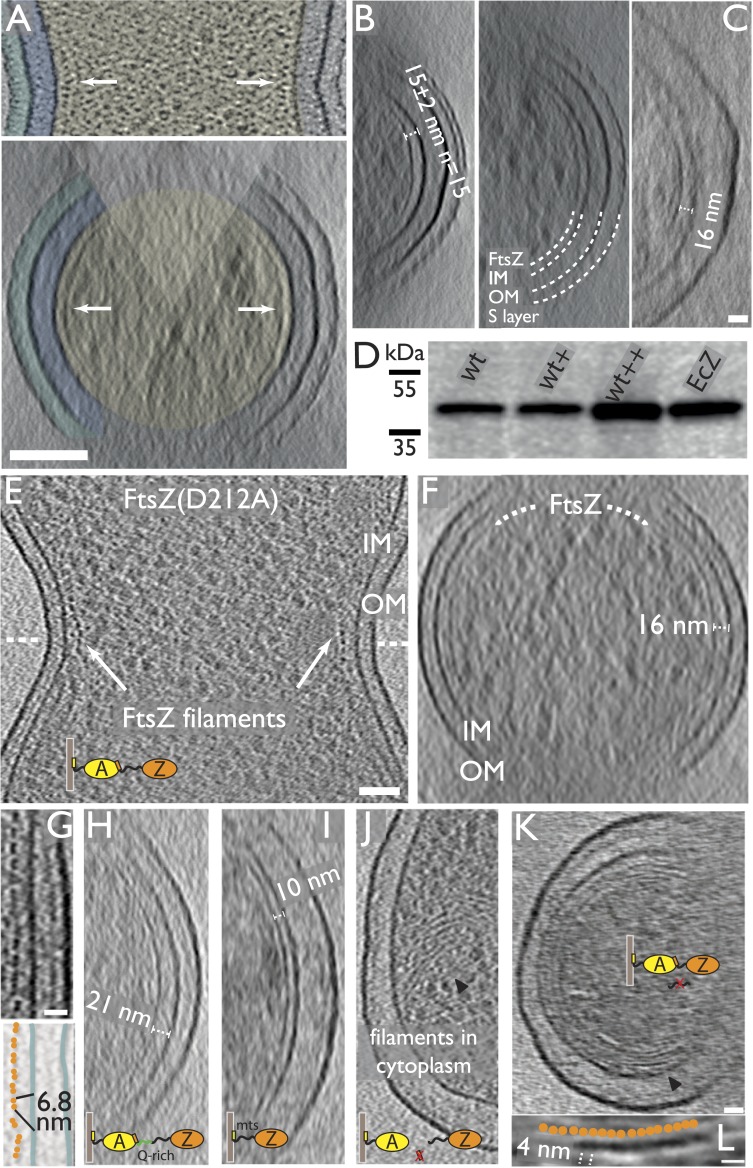
Figure 1. FtsZ forms bands of filaments completely encircling C. crescentus and E. coli division sites, as visualised by electron cryotomography.

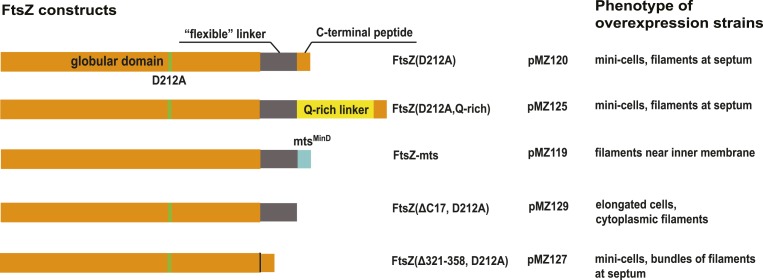
(A) C. crescentus NA1000/CB15N division site with filaments near the inner membrane IM (top panel, black dots highlighted by arrow, see also Video 1). Bottom panel shows the same cell rotated 90° around the short axis of the cell. The Z ring (arrow) is continuous and only invisible where there is no image because of the missing wedge (shaded triangle) (see Figure 1—figure supplement 1 for more details on the missing wedge problem). The cytoplasm (beige), periplasm (blue), and space between the OM and S layer (cyan) have been coloured for clarity. (B) More examples of continuous FtsZ rings found in C. crescentus cells. The filaments were on average 15 nm from the inner membrane. (C) Electron cryotomographic slice of the constriction site of a B/r H266 E. coli cell visualised perpendicular to the longitudinal axis, showing very similar FtsZ filaments when compared to C. crescentus (Figure 1A,B) and FtsZ(D212A) expressing E. coli cells (Figure 1F) and having roughly the same distance (16 nm) to the IM. Video 2 demonstrates the likely helical nature of the arrangement of the FtsZ filaments (see also Figure 1—figure supplement 2). (D) Western blot showing total FtsZ levels in cells used in (EG) are about 2.5× that of wild-type cells. (+) refers to un-induced, (++) was induced by 0.02% arabinose. EcZ is purified E. coli FtsZ protein. (EG) 10-nm thick electron cryotomographic slices of E. coli cells expressing FtsZ(D212A) protein in a wild-type B/r H266 background. See also Figure 1—figure supplement 3. (E) E. coli division site showing the cross-section of FtsZ filaments (single row of black dots) at the constriction site. See Video 3. (F) Visualisation of the same cell along the longitudinal axis shows that FtsZ filaments are located ∼16 nm from the inner membrane (IM). (G) Closer examination of the constriction site of another cell with higher expression level reveals FtsZ filaments form pairs, appearing as doublets of dark dots (upper) and orange spheres in the schematic illustration, on average 6.8 nm apart within the doublets (lower). (HK) 10-nm thick electron cryotomographic slices of E. coli cells expressing engineered protein constructs based on FtsZ(D212A) (see also Figure 1—figure supplements 3,5 and Supplementary file 1, Table B). (H) Extending the C-terminal linker of FtsZ by inserting a linker sequence pushes the filaments further away from the IM (distance changed from 16 nm to a somewhat variable 16–21 nm). (I) Replacing the C-terminal FtsA-binding sequence of FtsZ with a membrane-targeting sequence (mts) makes FtsZ directly bind to the IM and results in FtsZ filaments closer to IM (distance changed from 16 nm to 10 nm). No cell constrictions were observed with this construct. (J) Removing the C-terminal FtsA-binding sequence of FtsZ renders it unable to maintain a fixed distance to the IM and FtsZ filaments that were observed within the cytoplasm. (K) Removing the C-terminal flexible linker of FtsZ makes it prone to form multiple layers of filaments that form complete rings or helices. Tomography using this construct works better because it produces small minicells. (L) A closer inspection of the area marked with the black arrowhead in G shows beads along the filament as illustrated by the schematic drawing with a repeat distance of 4 nm as expected for FtsZ filaments. IM: inner membrane; OM: outer membrane; WT: wild-type; Q-rich: FtsN-derived flexible linker; mts: membrane-targeting sequence. Scale bars: 100 nm in (A) and (B), 50 nm in (E, F, H, I, J), 20 nm in (C, G, K), 10 nm in (H), 20 nm in (L).

DOI: http://dx.doi.org/10.7554/eLife.04601.003

Figure 1.

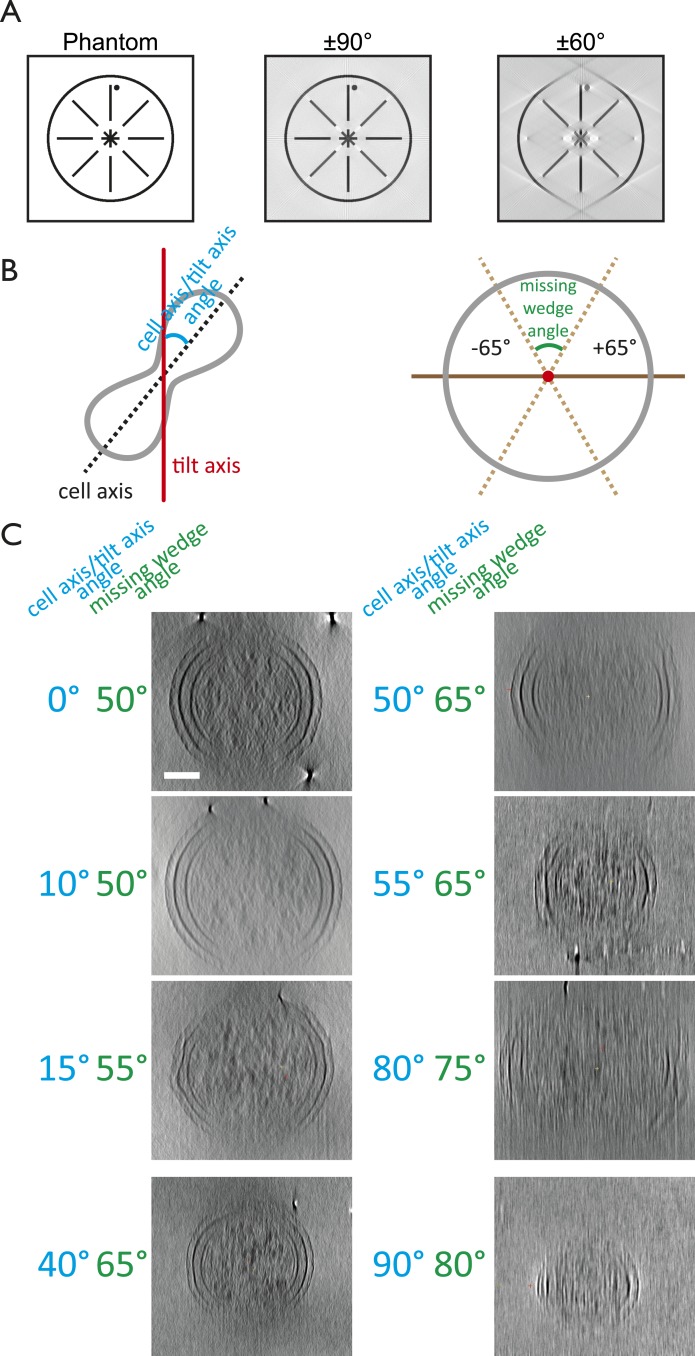
Figure 1—figure supplement 1. The missing wedge problem in cellular electron cryotomography.

Figure 1—figure supplement 1.

Since it is impossible to tilt the sample support (EM grids) from −90° to +90° and because the thickness of the ice film increases at high tilt angles, electron tomograms miss significant amounts of data. (A) Simulation of the effects of the missing wedge. Modified from Palmer and Löwe, (2013). A phantom image resembling a cell envelope was reconstructed for a full ±90° range and a ±60° range, the latter being typical for tilt series acquisition. (B) Schematic drawings explaining the angle (blue) between the tilt axis (red) and the cell axis (black dashed line) and the missing wedge angle (green). The former can be anything between 0 and 90°, whereas the latter can be anything between 0 and 180°. Tilt series for the C. crescentus study (Figure 1A–B) were obtained using the ±65° range. (C) Examples of the effects of different orientations of cells in the microscope with respect to the tilt axis on the missing wedge. Cells that were aligned with the tilt axis produced the most complete tomograms since the cell thickness stayed constant over the angular range. High tilts of those perpendicular to the tilt axis did not provide any useful information since the effective cell thickness in the electron beam increased. Shown are projections along the long axis of the cell. It is important to note that the angle between the tilt axis and the longitudinal axis of the cell is crucial in order to obtain high quality tilt series, other factors such as cell thickness, ice thickness, and membrane invagination progression also affect the quality of the resulting tomograms significantly. Scale bar: 100 nm.
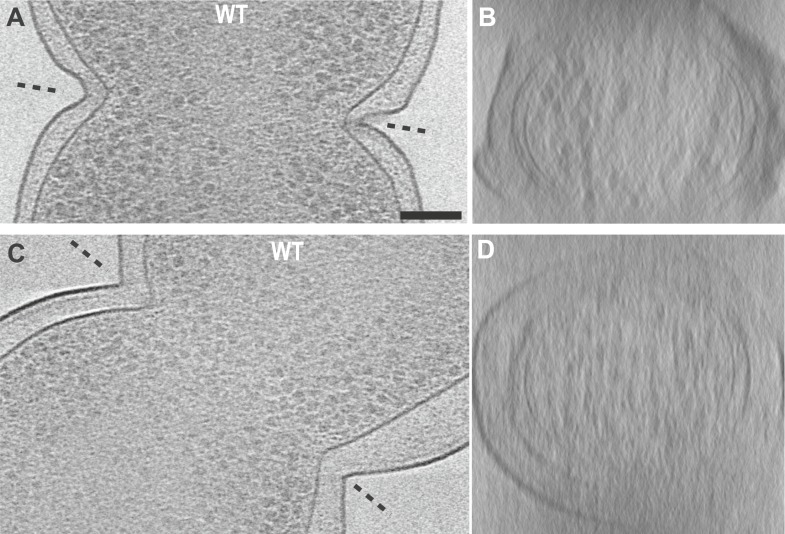
Figure 1—figure supplement 2. Electron cryotomograms of wild-type E. coli cells show filaments at the constriction sites.

Figure 1—figure supplement 2.

(A, C) 10-nm thick tomographic slices of two cells showing black dots near the constriction sites corresponding to cross-sections of filaments. Filaments are difficult to discern in this viewing direction because of the thick E. coli cells (B, D) Filaments are better visualised when viewed perpendicular to the constriction planes showing filaments near the IM. These images, together with Video 2, suggest that FtsZ forms a closed ring with slight helicity near the constriction site.
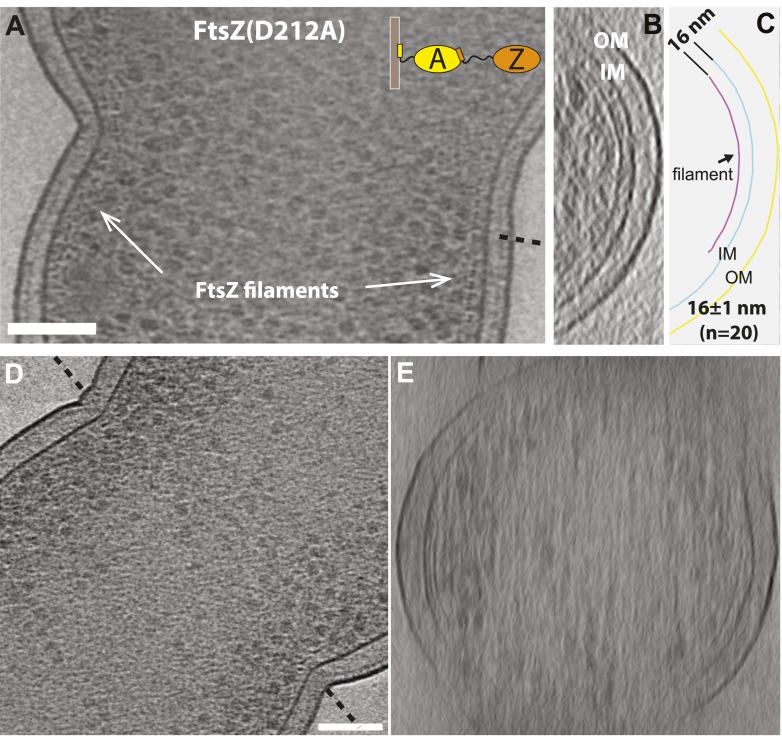
Figure 1—figure supplement 3. FtsZ forms bands of filaments at constriction sites in E. coli cells.

Figure 1—figure supplement 3.

(A) 10 nm electron cryotomographic slice of a cell expressing more FtsZ(D212A) protein than in Figure 1E (corresponds to Figure 1G), oriented parallel to the longitudinal axis, showing one layer of dots near the constriction site, corresponding to cross-sections of FtsZ filaments that are 16 nm away from the IM. (B) Electron cryotomographic slice of the cell viewed perpendicular to the dashed line in (A). FtsZ filaments and their relative position to the IM are illustrated with the schematic representation of the tomographic slice in (C). (DE) 10 nm electron cryotomographic slices of a cell with very low level expression of FtsZ(D212A) protein (un-induced) viewed parallel to the longitudinal axis in (D) and perpendicular to the dashed line in (D), showing similar architecture of FtsZ filaments at the constriction site. Scale bars: 100 nm.
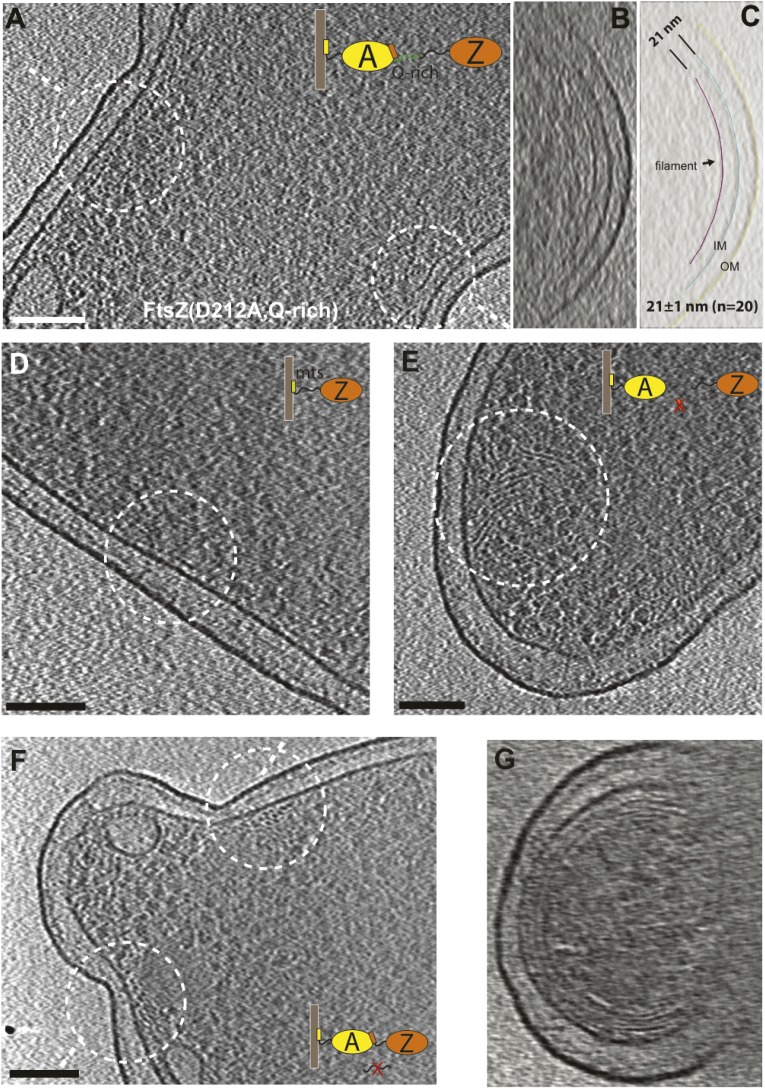
Figure 1—figure supplement 4. Engineered FtsZ proteins form filaments with altered localisation patterns in E. coli cells.

Figure 1—figure supplement 4.

(A) Extending the C-terminal flexible linker of FtsZ(D212A) makes the protein form filaments further away from the membrane with a distance to IM increased from 16 nm to 21 nm; (B) and (C) are tomographic slices of the cell viewed perpendicular to the dashed lines in (A) and segmentation illustrating the relative positions of FtsZ filaments and the IM; (D) cells expressing a membrane-binding FtsZ construct produced by fusing the E. coli MinD membrane-targeting sequence (mts) to the C-terminus of FtsZ produce filaments that are 10 nm away from IM; (E) removing the C-terminal FtsA-binding sequence of FtsZ gives filaments further away from the IM; (F) FtsZ without the C-terminal flexible linker tends to form multiple layers of filaments near the constriction site, and (G) such filaments appear to form complete rings or helices when viewed perpendicular to the plane of cell constriction. Scale bars: 100 nm.
Figure 1—figure supplement 5. Overview of FtsZ constructs used for in vivo tomography.

Figure 1—figure supplement 5.

Please also consult Supplementary file 1A,B.