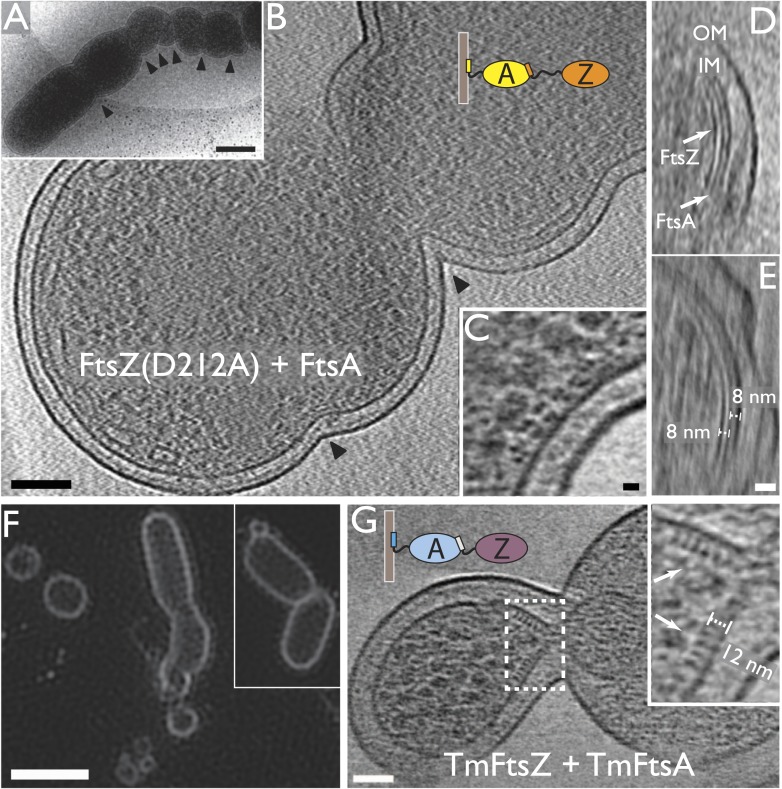
Figure 2. Co-expression of FtsZ and FtsA in E. coli cells leads to extra septa.
(A) A low-magnification 2D electron cryomicrograph (transmission) showing multiple constriction sites (marked with black arrowheads) along the cell. (B–E) 10-nm thick electron cryotomographic slices of cells co-expressing FtsZ(D212A) and FtsA (bicistronic, 1:1). Two layers of dots are visible at constriction sites in (B) and (C), corresponding to FtsZ filaments and FtsA filaments, respectively, as labelled in the orthogonal view along the long axis of the cell (D). FtsA filaments are almost in the middle between FtsZ filaments and the IM, at a distance of 8 nm from both FtsZ filament and IM as indicated in (E). (F) Structured illumination microscopy images of cells expressing FtsZ(D212A) and FtsA, showing cell division and minicell formation, proving that the extra septa function to completion. (G) 10-nm thick electron cryotomographic slice of an E. coli minicell formed from cells expressing Thermotoga maritima FtsZ and FtsA proteins, with a deeply constricted area showing cross-sections of FtsZ and FtsA filaments (black dots marked with white arrows). Distance between FtsZ filaments and IM is around 12 nm (inset in G). The view highlights striking similarities to the in vitro reconstruction shown in Figure 3H–J & 5C. IM: inner membrane; OM: outer membrane. Scale bars: 500 nm in (A), 100 nm in (B), 10 nm in (C, and also for inset in G), 20 nm in (E, and also for D), 2 μm in (F).

