. 2014 Dec 12;3:e04630. doi: 10.7554/eLife.04630

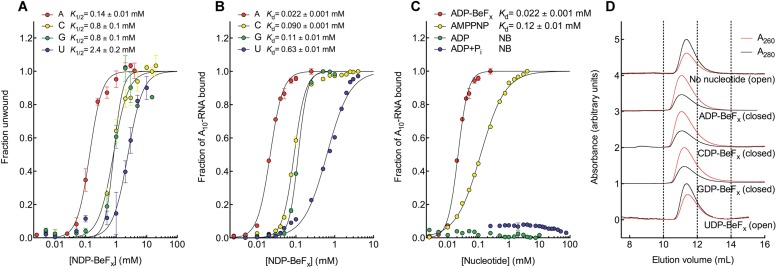
Figure 2. The biochemical basis for the ATP specificity of the helicase core of Mss116.

(A) dsRNA unwinding by the MBP-tagged helicase core measured under equilibrium conditions using a gel-based fluorescence assay to monitor the formation of a closed-state complex containing bound ssRNA at increasing concentrations of NDP-BeFx, N = A, C, G, or U (Figure 2—figure supplement 1). The fraction of unwound duplex was obtained by normalizing the band intensities separately for each gel using the parameters from the fit to a one-site binding model, as the change in fluorescence upon unwinding is different under each condition. The extent of unwinding with UDP-BeFx was less than that for the other nucleotide analogs, and the maximum concentration of UDP-BeFx used in this assay was insufficient to drive unwinding to completion (Figure 2—figure supplement 1). This could be because UDP-BeFx bound at saturating concentrations to D1 cannot efficiently induce a closed state. (B) Equilibrium binding of A10-RNA to the MBP-tagged helicase core determined by fluorescence anisotropy measurements at increasing concentrations of NDP-BeFx, N = A, C, G, or U. (C) Equilibrium binding of A10-RNA to the MBP-tagged helicase core determined as in (B) at increasing concentrations of ADP-BeFx, AMP-PNP, ADP, and ADP + Pi. Error bars in (AC) represent the standard error for at least three independent measurements, and the error in the K1/2 or Kd represents the standard error of the non-linear regression. NB, no appreciable binding. In (B and C), the fraction of A10-RNA bound was calculated by normalizing against the anisotropy signal for unbound and fully bound substrate obtained from the fit to a one-site binding model. (D) Normalized SEC profiles monitored by absorbance at 260 nm (red) and 280 nm (black) for the helicase core in the absence of all substrates and in the presence of A10-RNA + NDP-BeFx, N = A, C, G, or U. An A260/A280 >1 at the maximum absorbance indicates the formation of a closed-state complex.

DOI: http://dx.doi.org/10.7554/eLife.04630.005

Figure 2.

Figure 2—figure supplement 1. RNA unwinding measured by using a gel-based fluorescence assay to monitor the formation of a closed-state complex containing bound ssRNA.

Figure 2—figure supplement 1.

(A) Schematic representation of the equilibrium unwinding reaction measured in this assay. Unwinding was probed by using a 12-bp dsRNA substrate labeled with a fluorophore (6-carboxyfluorescein; FAM) and quencher (Iowa Black FQ; IBFQ) probes at the 5′ and 3′ ends, respectively. An increase in fluorescence of this substrate occurs when the helicase core unwinds the dsRNA and forms a closed-state bound to ssRNA. (BE) Representative unwinding assays for dsRNA (100 nM) by the helicase core of Mss116 (2 μM) measured at increasing concentrations of NDP-BeFx with N = A, C, G, and U for BE, respectively. Samples were loaded in the reaction medium and resolved in a non-denaturing 6% polyacrylamide gel run at 4°C in 0.5× Tris/Borate/EDTA buffer (pH 8.3). Arrows mark complexes corresponding to the open- (in the absence of NDP-BeFx) and closed-state protein bound to RNA. Proteins have an N-terminal MBP tag to increase solubility under the EMSA conditions. The double band seen in some lanes could be the result of one or two protein molecules bound to a partially unwound duplex or to a closed-state with or without a partially unwound second strand. (F) Control unwinding assay using an equivalent 12-bp 5′ FAM-dsRNA with no quencher to demonstrate that, under the assay conditions, the RNA is always bound to the helicase core and widely separated from free substrate.
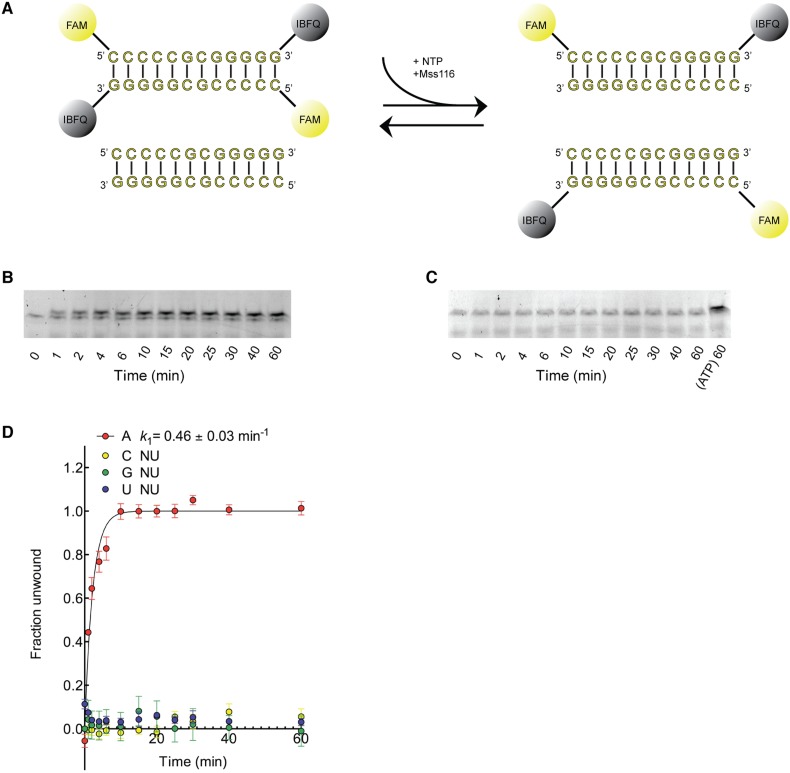
Figure 2—figure supplement 2. Kinetic assay of the unwinding of dsRNA by Mss116 with different NTPs.

Figure 2—figure supplement 2.

(A) Schematic representation of the unwinding reaction measured in this assay. Unwinding was probed by using a 12-bp dsRNA substrate labeled with a fluorophore (6-carboxyfluorescein; FAM) and quencher (Iowa Black FQ; IBFQ) probes at the 5′ and 3′ ends, respectively (IDT). An increase in fluorescence of this substrate occurs upon unwinding and re-annealing to an unlabeled strand from a duplex of the same sequence that is present in excess. (B) Representative unwinding time course for labeled dsRNA (125 nM) by the helicase core of Mss116 (2 μM) measured at 5 mM ATP-Mg2+. After the addition of stop buffer to remove any bound protein, duplex samples were resolved in a non-denaturing 20% polyacrylamide gel run at 4°C in 1× Tris/Borate/EDTA buffer (pH 8.3). (C) Representative unwinding time course for labeled dsRNA (125 nM) by the helicase core of Mss116 (2 μM) measured at 5 mM CTP-Mg2+ with samples resolved as in (B). The last lane represents the same duplex unwound by ATP after 60 min. (D) Kinetic unwinding profiles of dsRNA by Mss116 for NTP, N = A, C, G, or U. Error bars represent the standard error for at least three independent measurements, and the error in k1 represents the standard error of the non-linear regression. NU, no appreciable unwinding. Unwinding data for ATP were normalized using the parameters obtained from the fit to a first-order reaction with a single exponential. In the case of other nucleoside triphosphates where no unwinding was observed, data were normalized against the signal for a duplex fully unwound by ATP at the same concentration (see panel C, final lane). Assays were performed in a buffer containing 5 mM free Mg2+. Additional assays were performed at 0.5 mM Mg2+, as previous data indicate that the unwinding activity of Mss116 increases at lower Mg2+ concentrations (Halls et al., 2007). These gave similar results.