
Figure 3.
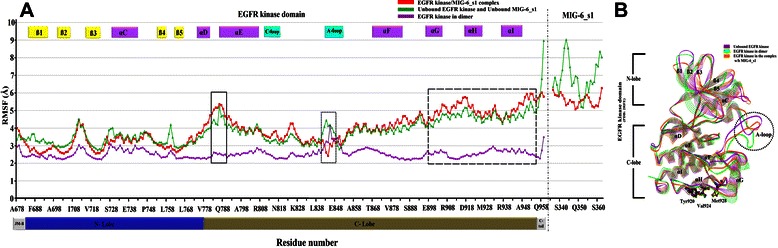
Graphical representation of root mean square fluctuation (RMSF) and superimposition of EGFR kinase. (A) The RMSF profiles of EGFR kinase bound MIG-6_s1 (in red), the unbound of EGFR kinase and MIG-6_s1 (in green), and EGFR kinase in the dimeric structure (in purple) with EGFR kinase (PDB: 2GS6). Most flexible regions can be seen as peaks in rectangles. (B) the superimposition of EGFR kinase monomers from 1) the unbound EGFR kinase (purple) 2) the EGFR kinase in the binding of MIG-6_s1 complex (orange) and 3) the dimer complex (green). The superimposition revealed the different mobility of the activation loop (A-loop).