
Figure 4.
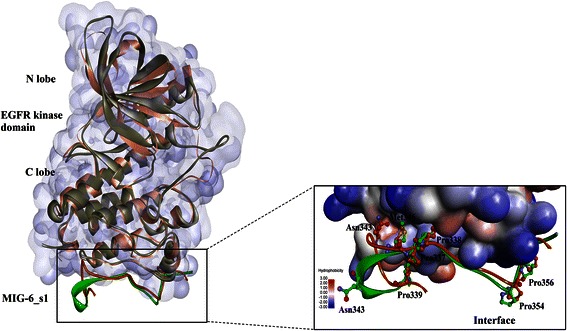
The superimposition of the average structure from the last 3 ns of simulations (light-pink) and its minimized initial structure (green) of the EGFR kinase /MIG-6_s1 complex. The positions of Asn343, Met346 and the cluster of prolines of MIG-6_s1 are shown in the ball-and-stick representation.