
Figure 6.
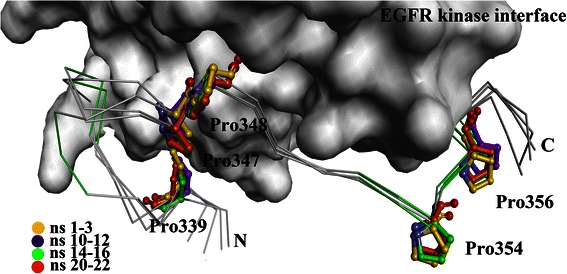
The superimpositions of the average structures during the 1–3 ns (yellow), 10–12 ns (purple), 14–16 ns (pink), and 20–22 ns (orange) simulations showed the stabilities of prolines over the course of simulations. The positions of prolines on MIG-6_s1 are indicated on the ball-and-stick representation of EGFR kinase.