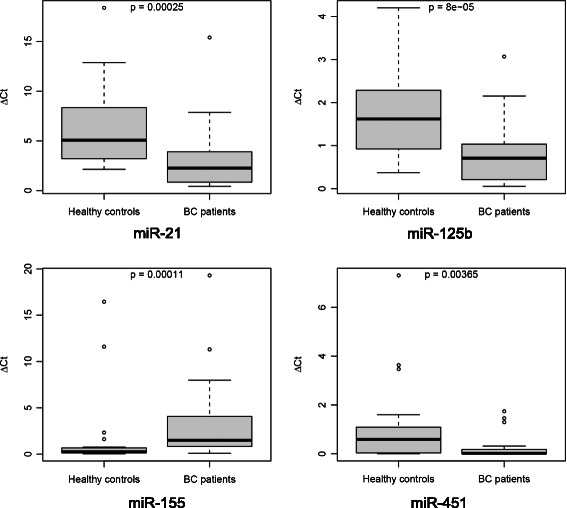
Figure 1.

Box plots of ΔCt-values of significant urinary miRNAs in breast cancer patients compared to healthy controls. Median urinary expression levels of miR-21 (2.27vs.5.07; p < 0.001), miR-125b (0.72vs.1.62; p < 0.001), and miR-451 (0.02vs.0.590; p = 0.004) were significantly decreased in BC patients compared to healthy controls, respectively. Urinary miRNA-155 expression was significantly increased in BC patients compared to healthy controls (1.49vs.0.25; p < 0.001). Median ΔCt-value and interquartile range of duplicate experiments. Thick lines: median (50% percentile); gray boxes: 25% to 75% percentile; thin lines: minimal and maximal value,0: moderate outlier. Mann Withney-U test. Quantitative realtime-PCR.
