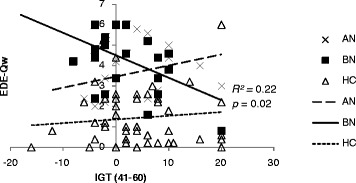
Figure 3.

Scatter plot shows the scores of the third block on IGT (41–60 within 100 trials) and the eating disorder examination questionnaire weight concern subscale (EDE-Qw) for AN, BN, and HC. Negative correlation was found in BN ( r = −0.47; p = 0.02).
