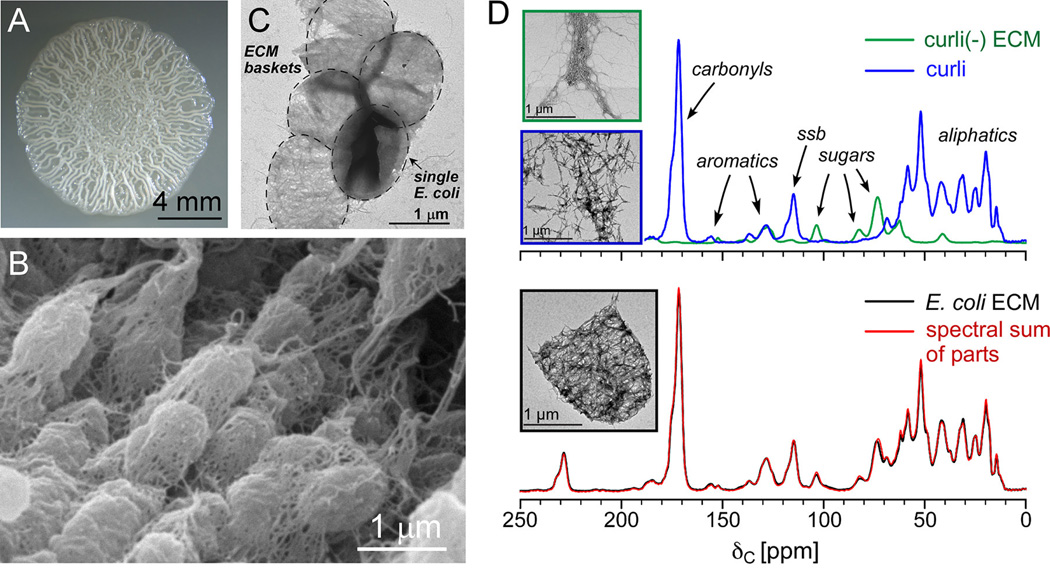
Figure 1. The bottom-up approach: E. coli biofilm phenotypes and ECM composition by solid-state NMR.
(A) The hallmark wrinkled colony morphology associated with biofilm formation of E. coli growing on YESCA nutrient agar. (B) Scanning electron micrograph on biofilms formed by the same uropathogenic E. coli strain, UTI89, as in panel A. (C) Transmission electron micrograph of a collection of ECM baskets following disruption of the biofilm with the tissue homogenizer, prior to low-speed centrifugation to remove intact cells (one bacterium present in TEM image). (D) The spectral sum of the UTI89ΔcsgA extracellular material and purified curli (top) completely recapitulates the 13C CPMAS spectrum of the intact UTI89 ECM (bottom), each associated with transmission electron micrographs associated with the samples. MAS was performed at 7143 Hz, and 32,768 scans were obtained for each spectrum. This figure is adapted from reference 18.

