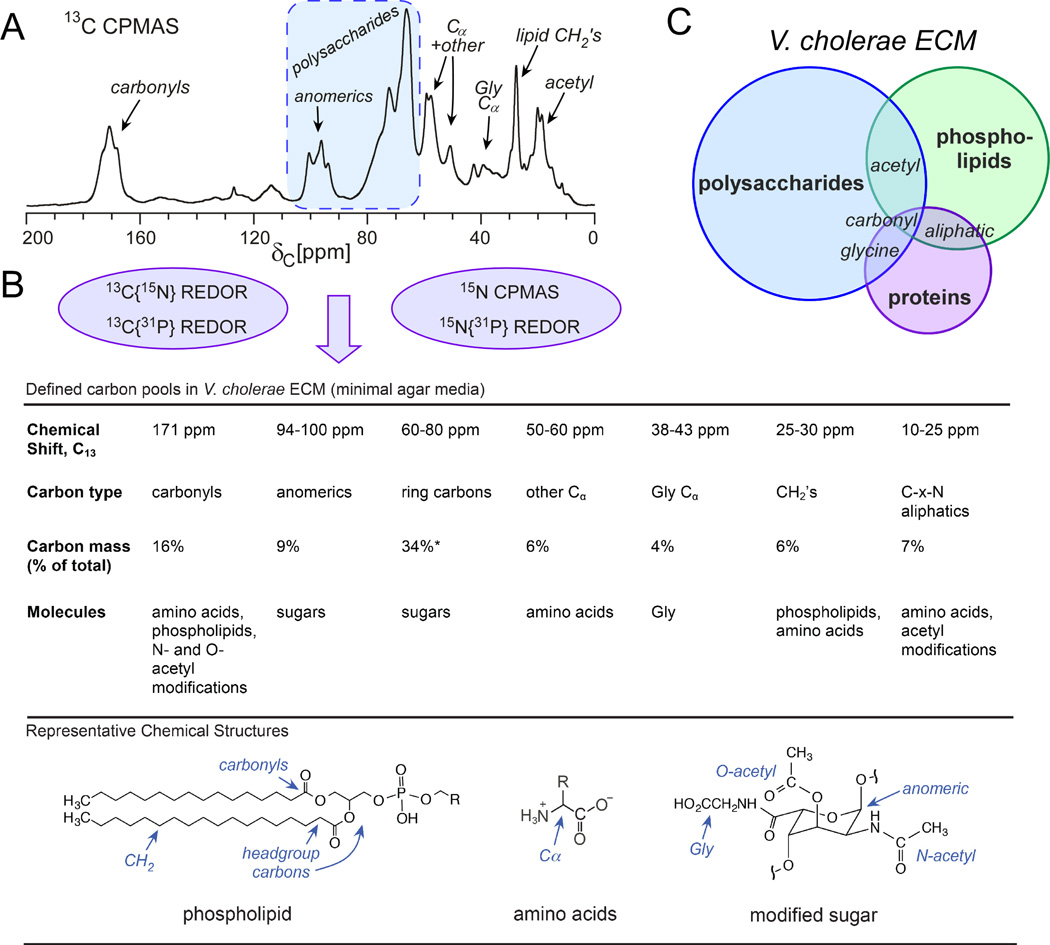
Figure 2. The top-down approach: V. cholerae ECM composition by solid-state NMR.
(A) The 13C CPMAS spectrum indicates that the ECM is polysaccharide rich and provides a snapshot of all of the general carbon types in the ECM. (B) REDOR experiments allowed for spectral editing and quantitation of more specific carbon pools as summarized in the table accompanied by illustrated molecular components and their carbon contributions. (C) Graphical summary of approximate V. cholerae ECM compositional pools. This figure is adapted from reference 19.

