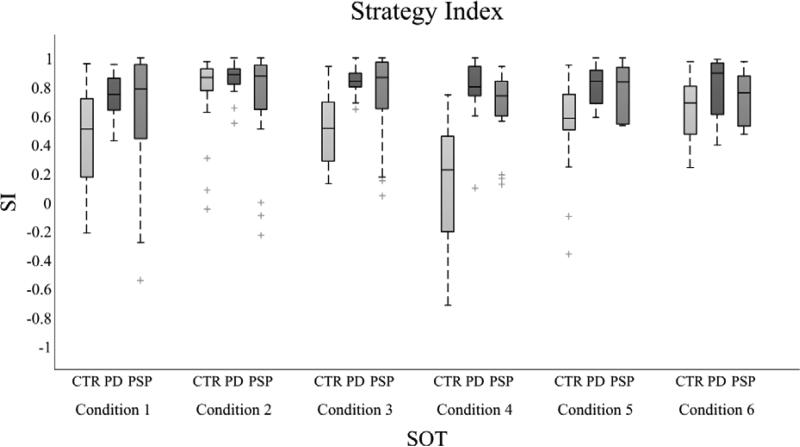
Figure 3.
Postural strategy index (SI) values for control, PD and PSP subjects in each SOT condition, represented using boxplots (central line is the median values, the box includes from the 25th to 75th percentiles and the whiskers extend to the most extreme data-points, with outliers plotted individually). In control subjects, in condition 4 the SI resulted significantly lower compared to all the other SOT conditions (p<0.05). Group differences in terms of SI were significant in condition 4, where both PSP and PD subjects showed a SI value higher than control subjects (p<0.05).

