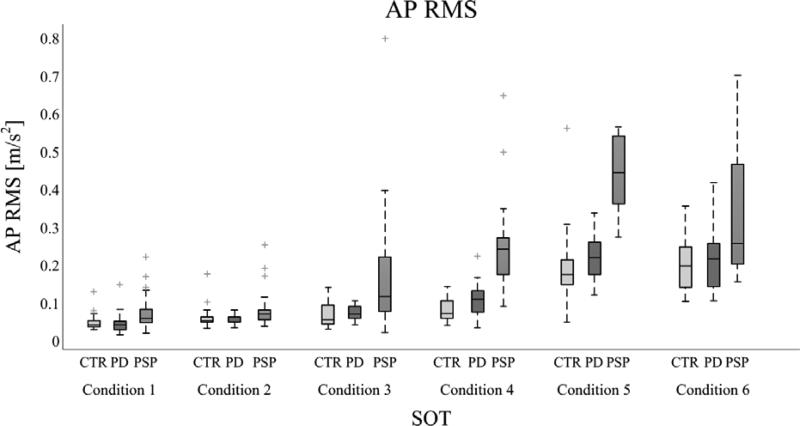
Figure 4.
The values of the AP RMS measure for control, PD and PSP subjects are represented in each SOT condition with boxplots (central line is the median values, the box includes from the 25th to 75th percentiles and the whiskers extend to the most extreme data-points, with outliers plotted individually).RMS reached the highest values in conditions 5-6 (movable support base) compared to conditions 1-3 (fix support base) in all the groups (p<0.05). The PSP subjects showed a much larger AP RMS compared to control and PD subjects in conditions 4-5(p<0.05). PSP subjects fell frequently: all the PSP subjects experienced at least 1 fall in the conditions 5-6. In contrast, all the PD and control subjects were able to perform all 6 conditions.

