Figure 1.

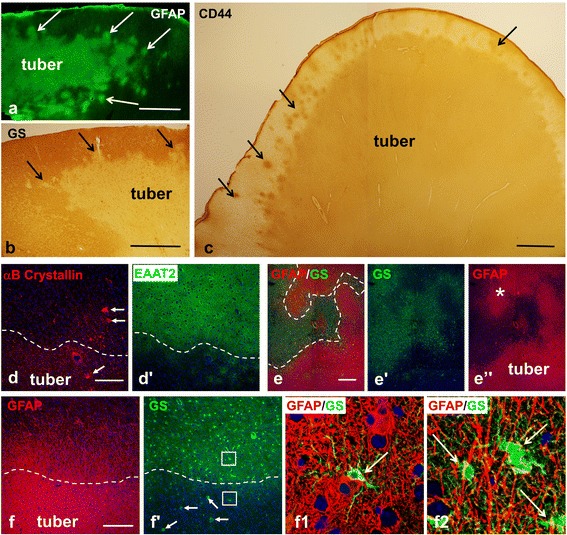
Astrogliosis delineates the border of cortical tubers. (a-c) High levels of GFAP (a) and CD44 (c) and low levels of glutamine synthetase (GS) (b) outline tubers from surrounding normal tissue. Note undulated surface of the tubers and appearance of small gliotic foci (microtubers) nearby (arrows, marked only some). (d) Gliotic tuber astrocytes reveal a profound decrease in EAAT2 and high levels of αB-Crystallin. Note: giant αB-Crystallin immunopositive cells (arrows) are present in tuber and in perituberal area. (e) A difference in the levels of GS and GFAP outline the main body (tuber) and gliotic protuberances (*) which make tuber border highly irregular in shape. (f) Protoplasmic (high levels of GS) and gliotic (high levels of GFAP) astrocytes are neatly segregated at a tuber border (dotted line). Note that giant cells (arrows) show high level of GS expression. (f1) (lower boxed area outlined in f) Only few protoplasmic astrocytes (arrow indicates one protoplasmic astrocyte) are located within the gliotic tuber tissue near the border. (f2) (upper boxed area outlined in f) Long processes of tuber astrocytes penetrate into the perituberal area populated with protoplasmic astrocytes (arrows). (d-f) Confocal microcopy, double immunostaining, counterstaining with Nissl. d’, e’, e”, and f’ represent split d, e, and f images, respectively. In d and d’ only split images obtained from double-immunostained sections are shown. Tuber border is depicted with dotted line. scale bars: 950 μm in a-c; 150 μm in d-f.
