
Figure 5.
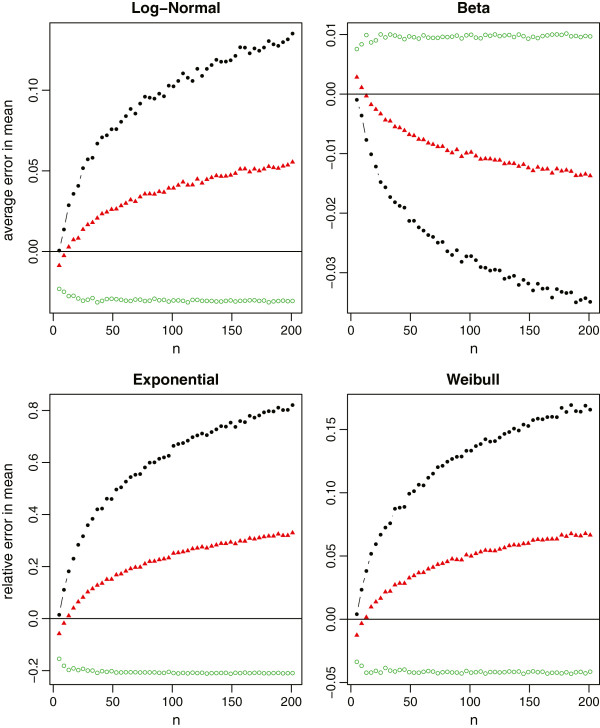
Relative errors of the sample mean estimation for non-normal data (log-normal, beta, exponential and Weibull), where the black lines with solid circles represent the method under scenario
 , the red lines with solid triangles represent the method under scenario
 , and the green lines with empty circles represent the method under scenario
 .
.