. 2015 Jan 26;4:e03971. doi: 10.7554/eLife.03971

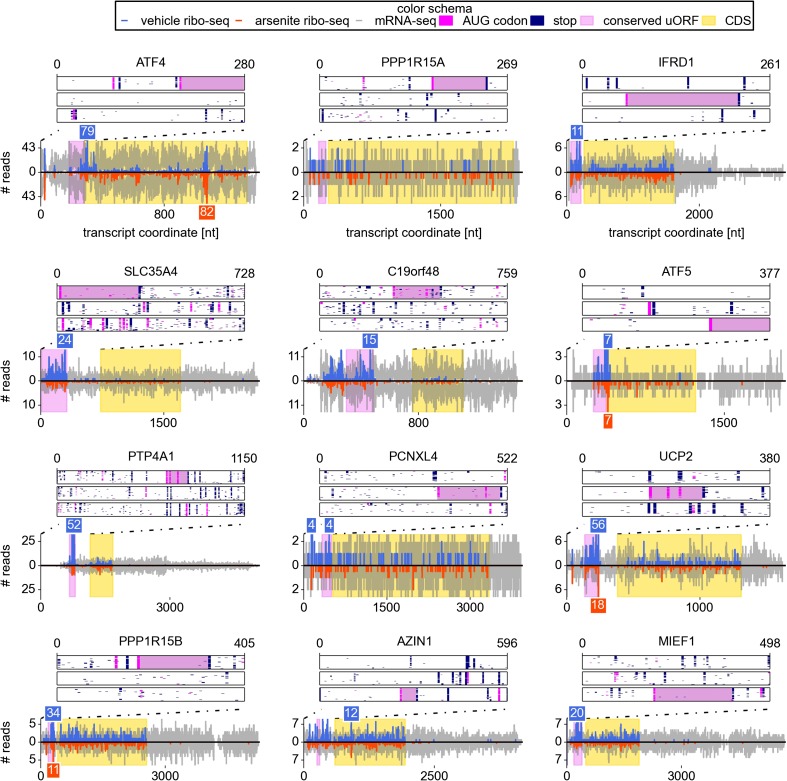
Figure 2. Upstream open reading frame (uORF) conservation and ribosome density for the eight top most stress resistant mRNAs in terms of their translation efficiency and also for mRNAs of UCP2, PPP1R15B, AZIN1, and MIEF1.

Bottom plots for each mRNA show counts of mRNA-seq reads (grey) and ribosome reads (blue and red) as columns (control: positive values; arsenite treatment: negative values). The annotated CDS region is highlighted in yellow. Translated conserved ORFs in the 5′ leaders are highlighted in violet. Read counts above the cut-off are shown with numbers above corresponding columns. Top plots represent conservation of uORF features within the leaders of the orthologous mRNAs (upstream of annotated CDS) obtained from the analysis of genomic alignments of the 46 vertebrates using the human sequence as a reference. Each box corresponds to one of the three reading frames where AUG codons are shown as pink dots and stop codons as navy dots in each of the genomic sequences used in the alignments. Regions of multiple sequence alignment corresponding to translated conserved uORFs are highlighted in violet. Introns and gaps were removed from the alignments.

DOI: http://dx.doi.org/10.7554/eLife.03971.008

Figure 2.

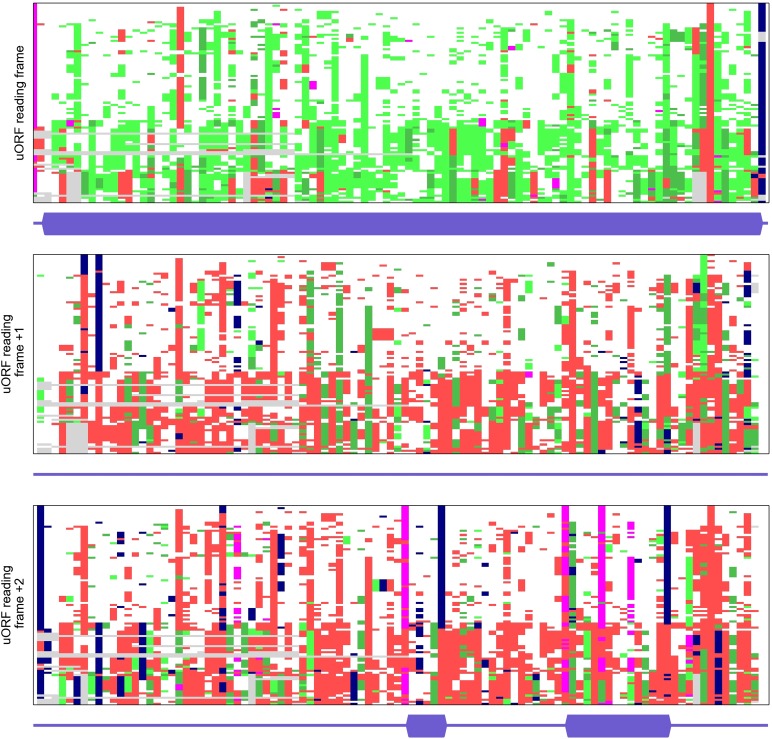
Figure 2—figure supplement 1. Multiple alignments of codon sequences from 100 vertebrate genomes aligned to the region of the conserved SLC35A4 upstream open reading frame (uORF) in three different frames.

Figure 2—figure supplement 1.

Codons are represented as coloured bricks according to the following scheme: pink (ATG), navy (stop codons: TAA, TAG or TGA). The rest are coloured depending on the nature of substitution relative to the human sequence as follows: white: no substitution; light green: synonymous; green: positive (BLOSUM62 > 0); red: negative (BLOSUM62 ≤ 0); deletions: grey. Locations of ORFs (from ATG to a stop) present in humans are shown under each alignment as a thicker dark blue bar. Regions of alignment with a high number of light green or green bricks (synonymous and positive substitutions) indicate protein coding evolution. The codon substitution analysis was carried out using CodAlignView (Jungreis I, Lin M, Kellis M. CodAlignView: a tool for visualizing protein-coding constraint) and processed with a python script to remove sequences of codons.
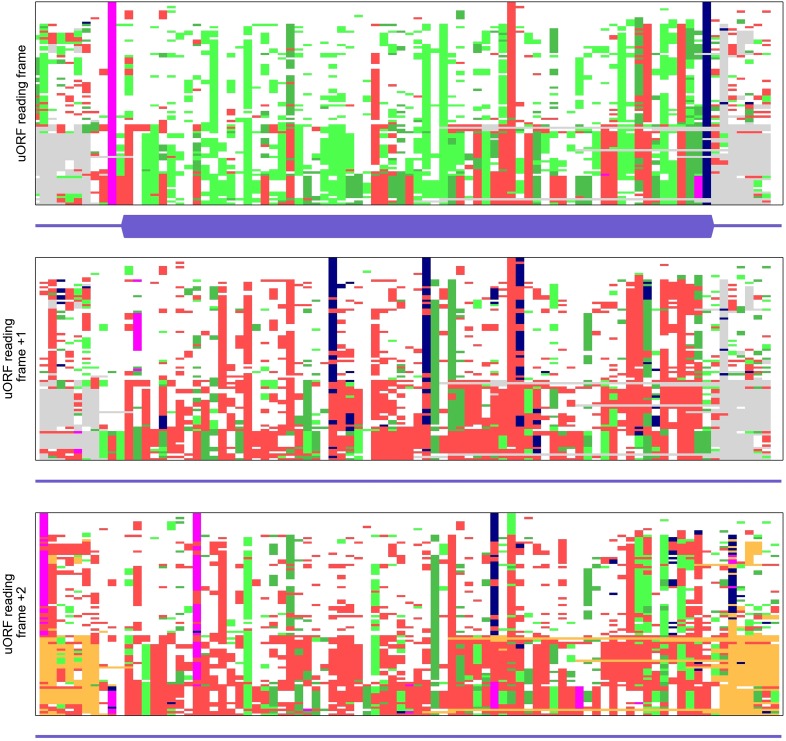
Figure 2—figure supplement 2. Multiple alignments of codon sequences from 100 vertebrate genomes aligned to the region of conserved MIEF1 upstream open reading frame (uORF) in three different frames.

Figure 2—figure supplement 2.

See Figure 2—figure supplement 1 for the explanation of the colour scheme used for the alignment visualization.
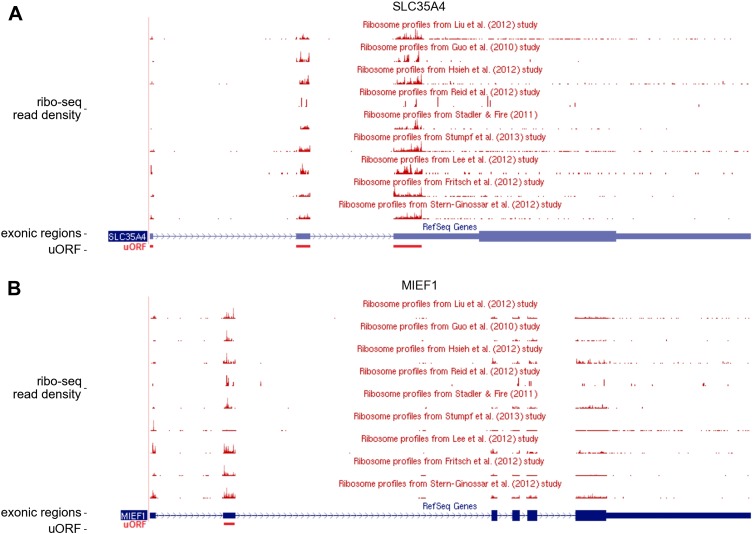
Figure 2—figure supplement 3. Publicly available ribosome profiling data in GWIPS-viz for SLC35A4 and MIEF1.

Figure 2—figure supplement 3.

Ribosome profiling data aligned to the SLC35A4 (A) and MIEF1 (B) loci of the human genome from nine studies available in the GWIPS-viz Browser. The positions of the conserved upstream open reading frames (uORFs) are shown with a red bar below the blue bars representing corresponding RefSeq transcripts.