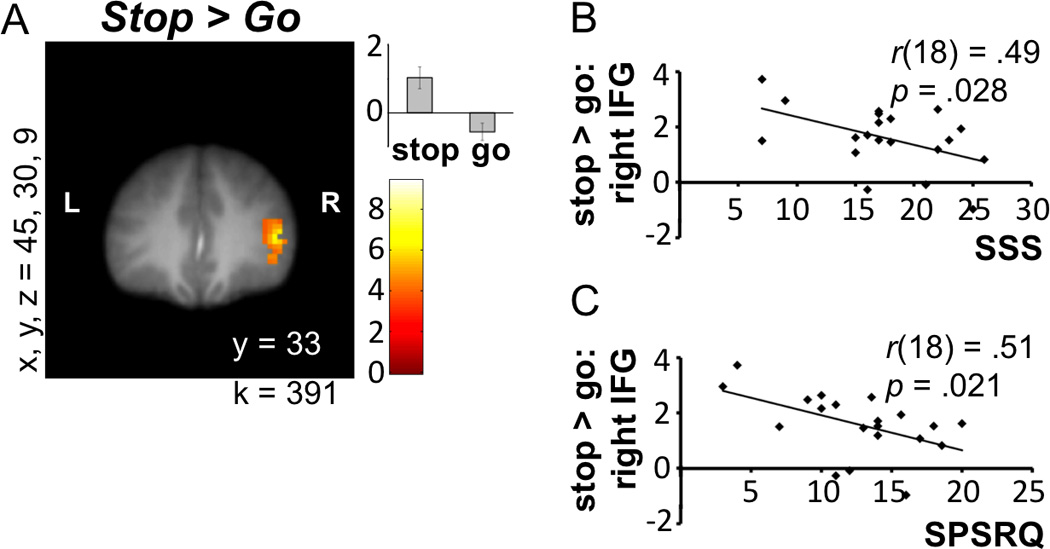
Figure 3.

Coordinates for x, y, and z refer to the left–right, anterior–posterior, and inferior–posterior coordinates in MNI space, and k represents cluster size. L and R refer to left and right. (A) rIFG activity preceding Stop decisions. (B) Correlation between rIFG activity during safe versus risky decisions and sensation-seeking (SSS). (C) Correlation between rIFG activity during safe versus risky decisions and sensitivity to reward and punishment (SPSRQ). Units in bar graph are arbitrary.
