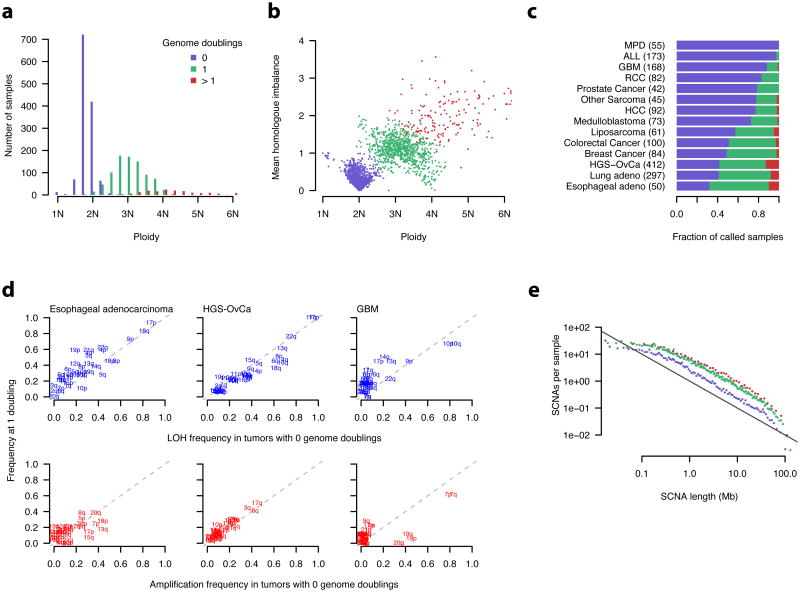
Figure 6. Incidence and timing of whole genome doubling events in primary cancers.
a, b, Ploidy estimates were obtained from ABSOLUTE. Mean homologue imbalance was calculated as the average difference in the homologous copy numbers at every position in the genome. Genome doubling status was inferred from the homologous copy numbers (Online Methods, Supplementary Fig. 9).
c, MPD – myeloproliferative disease, ALL – acute lymphoblastic leukemia, GBM - Glioblastomamultiforme, RCC - renal cell carcinoma, HCC - hepatocellular carcinoma, HGS-OvCa - high-gradeserous ovarian carcinoma.
d, LOH (loss of heterozygosity) was defined as 0 allelic copies. Amplification was defined as > 1allelic copy for samples with 0 genome doublings, and as > 2 allelic copies for those with 1genome doubling. Calls were made based on the modal allelic copy numbers of eachchromosome arm. Dashed lines indicate y=x.
e, SCNAs, defined as regions differing from the modal absolute copy number of each sample,were binned at adaptive resolution to maintain 200 SCNAs per bin, and renormalized by binlength. The value in each bin was further divided by the number of tumor samples in eachgenome doubling class, indicated by color as in a. The black line indicates slope = −1. Linearregression models were fit independently for each class using SCNAs 0.5 < x < 20 Mb. Thisresulted in fitted slope values of -1.05, -0.96, and -0.88 for 0, 1, and > 1 genome doublings,respectively (not shown).

