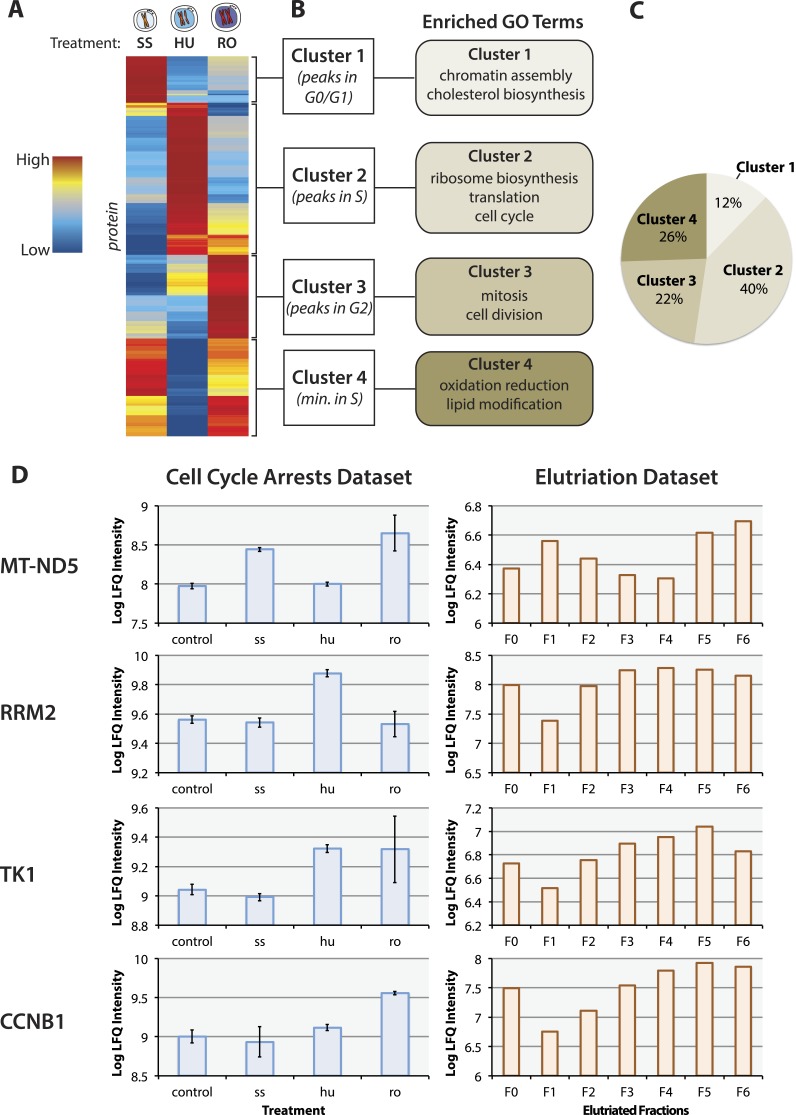
Figure 2. The proteomic response to cell cycle arrests.
(A) The final proteomic dataset after quality control filtering consisted of 3,068 proteins identified with two or more peptides per protein and quantitated in all three replicates within a treatment group. 484 proteins vary in abundance between asynchronous arrested cells using cutoffs based on effect size (≥twofold change between any two conditions) and statistical robustness (p < 0.05, ANOVA). The scaled and clustered abundances of these 484 arrest regulated proteins are illustrated as a heatmap. Each protein is represented by a horizontal line, and the colour (red: high, blue: low) represents the scaled abundance in three treatments. (B) We identify four clusters based on peak expression, which are differentially enriched in gene ontology (GO) biological functions. (C) The proportions of arrest regulated proteins in each cluster. (D) Comparison of the protein abundance changes measured in the cell cycle arrest data set vs the elutriation data set (Ly et al., 2014) for selected proteins (MT–ND5, RRM2, TK1, and CCNB1). Error bars indicate the standard error of the mean log-transformed abundances.

