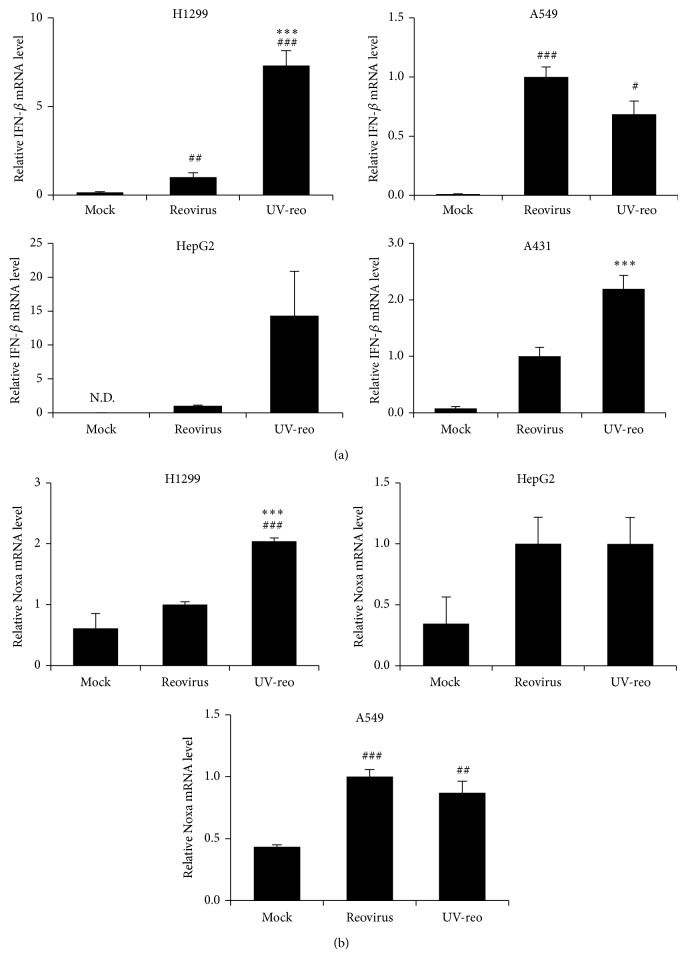
Figure 4.
Expression levels of IFN-β and Noxa following addition of UV-irradiated reovirus in tumor cells. (a), (b) IFN-β and Noxa mRNA levels following the addition of reovirus or UV-reo. Reovirus and UV-reo were added to the cells in equivalent doses for an MOI of 20. Following a 24-hour incubation, cells were harvested for the evaluation of IFN-β and Noxa mRNA levels by qRT-PCR analysis. Data were normalized by the data of reovirus group. The data shown represent the mean ± SD of triplicate measurements. # P < 0.05, ## P < 0.01, and ### P < 0.001, compared with mock group; *** P < 0.001, compared with reovirus group.

