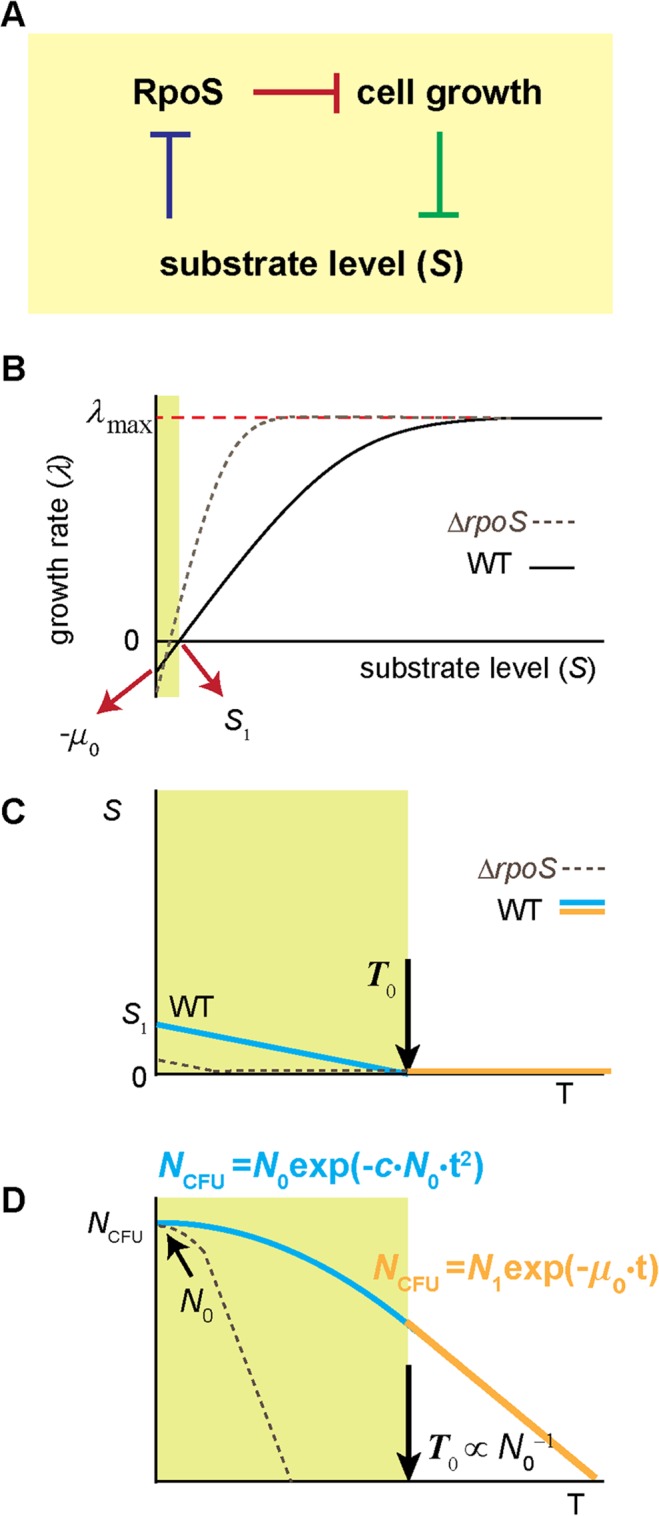
Fig 4. A mechanistic account of the density-dependent, biphasic survival kinetics.

(A) Cells consume substrates for cell growth and the substrate concentration decreases in the medium (green line). When the concentration decreases to the levels affecting the rate of cell growth, RpoS accumulates (blue line) [26,27]. RpoS represses cell growth (red line) [30–32], forming negative feedback. In the feedback scheme, at low substrate levels, RpoS strongly represses cell growth and hence, substrate consumption, allowing cells to conserve a small amount of the substrate before it is completely depleted by cell growth. See the text for details. (B) This feedback predicts that as the substrate concentration is reduced, the growth arrest occurs at a non-zero substrate concentration S 1, i.e., λ = 0 at S = S 1 > 0. This prediction agrees with previous studies [33–35]. Importantly, further studies show that although the growth rate of the population is zero at S = S 1, the substrate consumption rate is not zero; see [36] for review. This is commonly known as maintenance requirement; it requires continuous influx of the substrate to maintain a constant population size (λ = 0). If the influx of the substrate is less than the level needed for the maintenance, λ < 0 (green region) [37,38]. Our model indicates that λ(0) = − μ 0; see the text for details. As a comparison, the relation of λ and S in the ΔrpoS strain is shown as a dashed line. Note that at intermediate substrate concentrations, λ of ΔrpoS strain is higher than that of the wild type strain [30–32]. Also, note that when the substrate is completely exhausted, the culture of the ΔrpoS strain loses viability more rapidly than the wild type strain (see [18,25] and Fig. 2B); thus, the value of λ(0) of ΔrpoS strain should be less than that of the wild type strain. (C, D) At the onset of growth arrest (time zero in S1B Fig), S = S 1; see Fig. 4B. Without additional influx of the substrate, S will continue to decrease over time due to the consumption for the maintenance (cyan line in green region in Fig. 4C). Following the relation between λ and S depicted in Fig. 4B, λ will continue to decrease over time too. This will result in gradual decrease of N CFU (cyan line in green region in Fig. 4D). At some point (T 0), the substrate gets completely depleted (orange line in Fig. 4C) and N CFU decreases exponentially at a fixed rate of λ (0) afterwards (orange line in Fig. 4D). For the culture with higher cell-densities, S will decrease faster because the substrate is consumed by more cells, leading to shorter periods of the first phase. Quantitative formulation of these processes straightforwardly leads to a mathematical solution equal to the empirical formulas (Eqs (3) and (4)). The solid lines in Fig. 1 and S2 Fig show the fits of the solution to the data. See the text for details.
