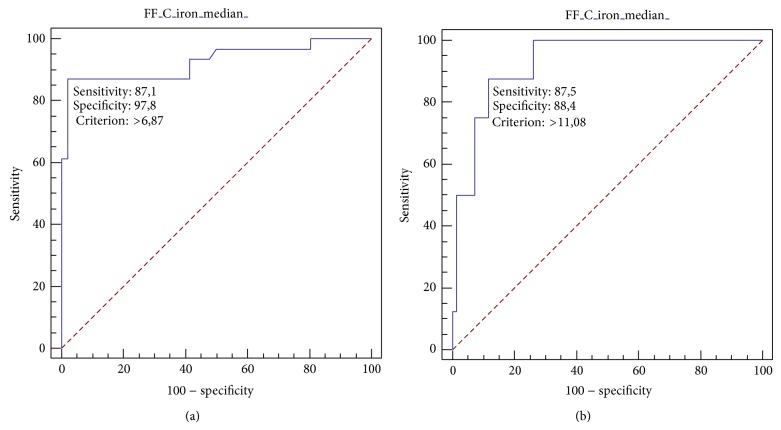
Figure 5.
ROC curve analysis of MRI PDFF for patients with steatosis S ≥ 1 (S0 versus S1-S2). The area under the ROC curve is 0.926 (95% CI 0.74–0.94) (a). ROC curve analysis of MRI PDFF for patients with steatosis S = 2 (S0-S1 versus S2). The area under the ROC curve is 0.929 (95% CI 0.806 to 0.968) (b).

