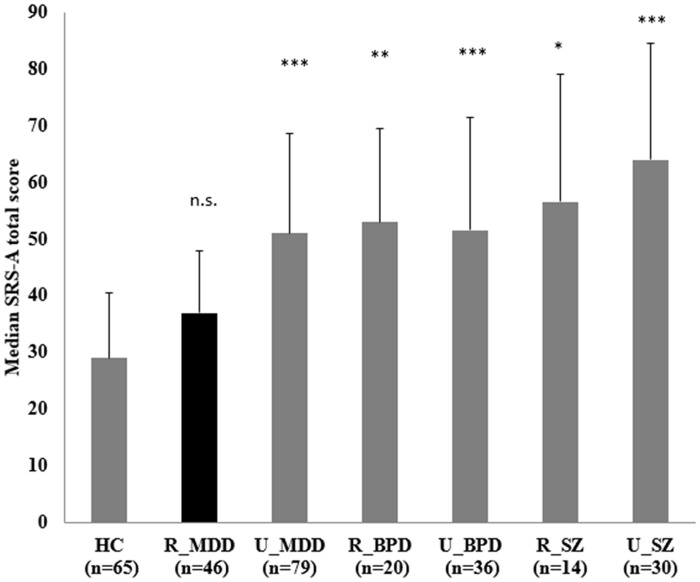
Fig 2. Comparison of the degree of ALTs among the 7 subgroups.
SRS-A total scores were compared among the 7 subgroups (i.e., HC and remitted/unremitted MDD, BPD and SZ) using Kruskal Wallis test; Dunn's test was used for further pair-wise multiple comparison. Results of pair-wise comparison between each clinical subgroup and HC are shown with error bar showing quartile deviation. HC: healthy control. MDD: major depressive disorder. BPD: bipolar disorder. SZ: schizophrenia. R: remitted. U: unremitted. n.s. p>0.05, * p<0.05, ** p<0.01, *** p<0.001 (all against HC)

