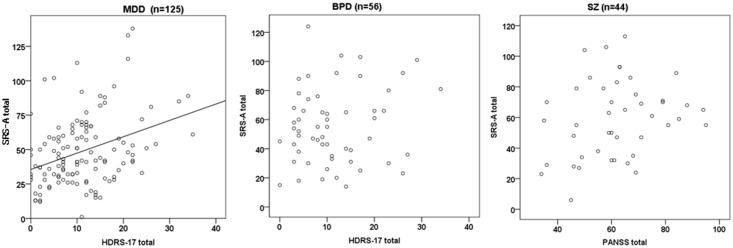
Fig 3. Scatter plots of SRS-A total raw score and symptom severity.

Significant correlation was found between the SRS-A and HDRS-17 total in the MDD group (r = 0.32, p<0.001), but not in the BPD group (r = 0.16, n.s.). No correlation was found between the SRS-A and PANSS total in the SZ group (r = 0.25, n.s.).
