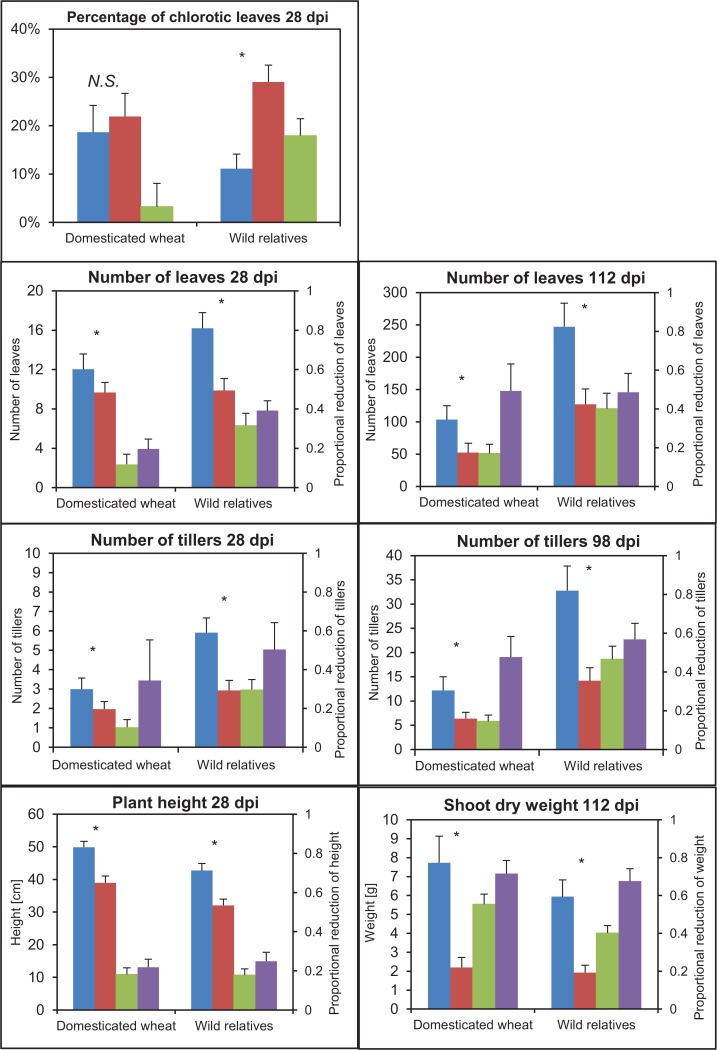
Fig 4. Plant response in the wild and domesticated groups.
BLUE = Mean values and 95% confidence interval (CI) of non-exposed, and RED = exposed plants, GREEN = absolute reduction, PURPLE = proportional reduction of the wild and domesticated groups for the studied traits. Pairwise comparison (t-test) between non-exposed and exposed plants with Bonferroni correction. dpi refers to days after the end of exposure to viruliferous leafhoppers. * = p<0.05, N.S. = no significance.

