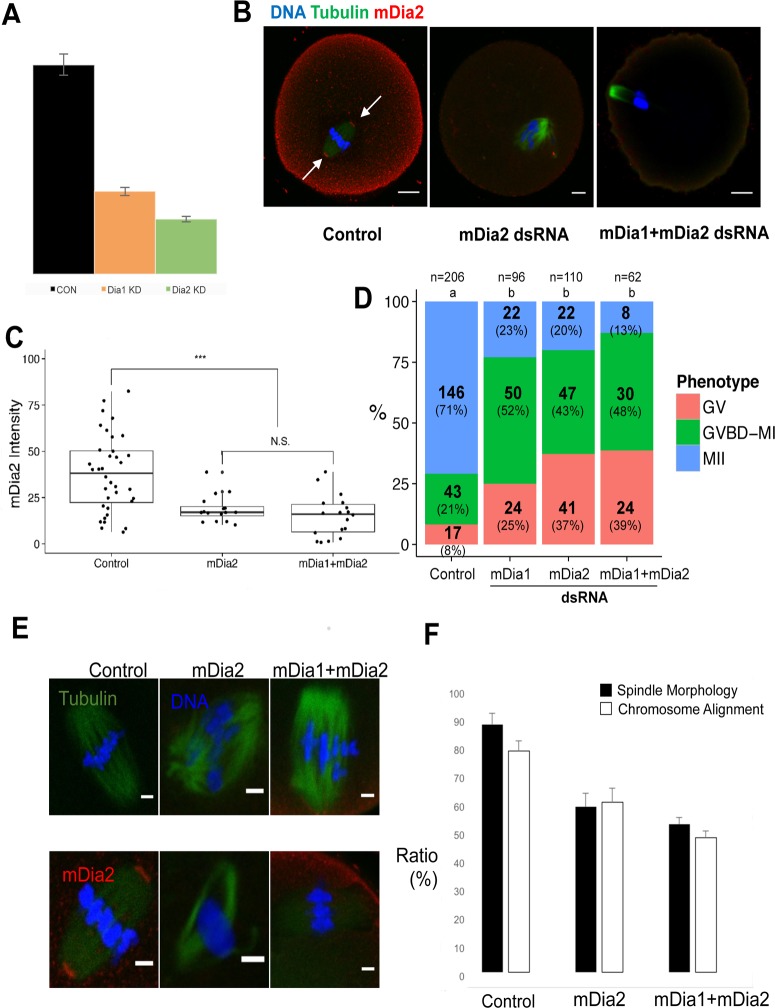
Fig 4. Knockdown of mDia formins impairs oocyte maturation and spindle formation.
A. The RNA levels of mDia1 and mDia2 in oocytes injected with dsRNAs against mDia1 and mDia2. The expression levels are expressed relative to the expression level in control oocytes treated with control dsRNA. B. Morphology and mDia2 localization in oocytes injected with control, mDia2, or mDia1 + mDia2 dsRNAs. Red: mDia2; green: α-tubulin; blue: DNA. White arrows indicate mDia2 located at the spindle poles in control oocytes. C. Quantification of mDia2 in oocytes injected with control, mDia2, or mDia1 + mDia2 dsRNAs. ***: significantly different from the negative control dsRNA-injected oocytes (p < 0.001); N.S.: not significant (p > 0.05). The boxes show the interquartile range; the whiskers show the 1.5 × the interquartile range; the line inside the box represents the median. D. Knockdown of mDia1, mDia2, or mDia1 + mDia2 decreases the oocyte maturation rate and increases the symmetric division rate. dsRNA against mDia1, mDia2, or a mixture of mDia1 and mDia2 were microinjected into immature oocytes along with control dsRNA and cells were cultured for 12 h after which their status of development was assessed. Significant differences (p < 0.05) between different treatments are indicated by a different superscript letter. E. Knockdown of mDia2 or mDia1 + mDia2 impairs spindle formation. Oocytes injected with mDia2, mDia1 + mDia2, or control dsRNA were incubated for 9 h and their spindle morphology was assessed after immunostaining for alpha-tubulin (green), chromatin (blue), and mDia2 (red). F. Percentage of oocytes with a normal spindle after injection with Dia2, mDia1 + mDia2, or control dsRNA. The filled bar represents the oocytes that had a spindle with normal morphology, while the white bar represents the oocytes that displayed normal chromosome alignment in spindle. Each experiment was performed in triplicate and the mean ratios of cells with normal spindles and chromosome alignment were plotted. Error bars indicate the standard error of the mean (SEM). ***: significantly different (p < 0.005); N.S.: not significant (p > 0.05).

