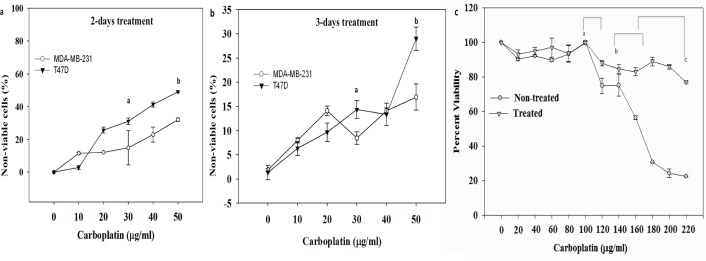
Fig 2. Effect of carboplatin treatment on the viability of breast cancer cell lines.
a) Percentage of non-viable cells at 2 days post treatment with carboplatin. The results are shown as the mean±SD, n = 7 of non-viable cells. a p<0.05, significant increase in non-viable BCCs at 30 μg/ml as compared to 0 μg/ml. b p<0.05, significant increase in non-viable BCCs at 50 μg/ml as compared to 0 μg/ml and 30 μg/ml. b) Percentage of non-viable cells 3 days post treatment. a p<0.05, significant increase in non-viable BCCs at 30 μg/ml as compared to 0 μg/ml. b p<0.05, significant increase in non-viable BCCs at 50 μg/ml as compared to 0 μg/ml and 30 μg/ml. c) Carboplatin survival curve for chemotherapy treated and non-treated MDA-MB-231 cells, a p<0.05, significant decrease in percent viability (30%) of non-treated cells treated with carboplatin dosages between 100 μg/ml to 120 μg/ml as compared to treated cells (10%). b p<0.05, significant decrease in percent viability (40%) of non-treated cells treated with carboplatin dosages between 140 μg/ml to 170 μg/ml as compared to treated cells (20%).c p<0.05, significant decrease in percent viability (80%) of non-treated cells treated with carboplatin dosages 170 μg/ml to 220 μg/ml as compared to treated cells (20%).

