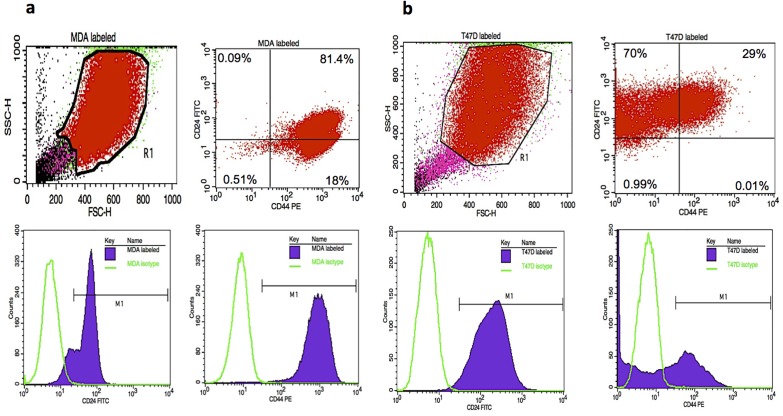
Fig 4.
Flow cytometry analysis of CD44/CD24 expression of A) Top left: suspension of MDA-MB-231 treated cells analyzed based on size with forward-scattered light (FSC) and side-scattered light (SSC). Top right: R1 population further analyzed by specifically gating for CD44/CD24 expressing cells. Bottom left: histogram of MDA isotype control and CD24-FITC with histogram marker M1 designating CD24-FITC positive events. Bottom right: histogram of MDA isotype control and CD44-PE with histogram marker M1, designating CD44-PE positive events. B) Top left: suspension of T47D treated cells analyzed based on size with FSC and SSC. Top right: R1 population further analyzed by specifically gating for CD44/CD24 expressing cells. Bottom left: histogram of T47D isotype control and CD24-FITC with histogram marker M1 designating CD24-FITC positive events. Bottom right: histogram of T47D isotype control and CD44-PE with histogram marker M1, designating CD44-PE positive events.

