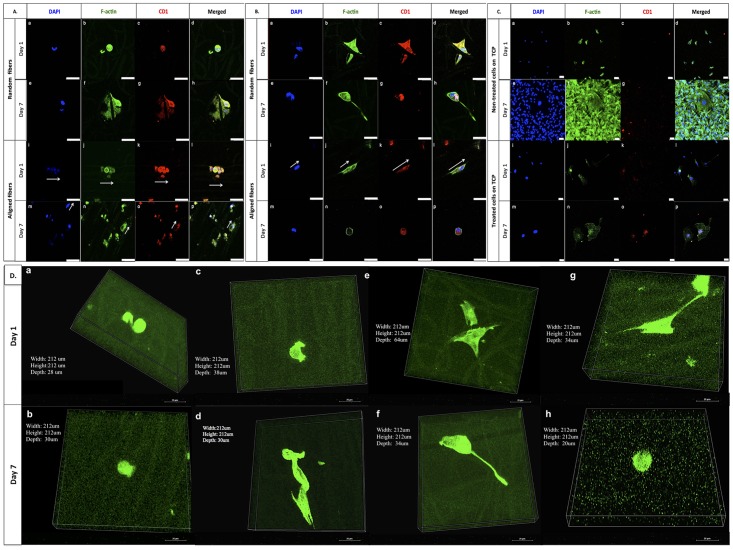
Fig 5. Confocal fluorescent microscope images of MDA-MB-231 BCCs on the PCL random and aligned fibrous scaffolds and TCP control.
Blue indicates nuclei (DAPI); green indicates F-actin (Alexa 488) and red is for anti-cyclin D1 expression. A) Non-treated BCCs on random scaffolds (a through d at day 1; e through h at day 7) and aligned scaffolds (i through l at day 1; m through p at day 7). B) Treated BCCs on random scaffolds (a through d at day 1; e through h at day 7) and aligned scaffolds (i through l at day 1; m through p at day 7). C) Non-treated BCCs (a through d at day 1; e through h at day 7) and treated BCCs (i through l at day 1; m through p at day 7) on TCP. All scale bars are 50 μm. D) Volume View of MDA-MB-231 BCCs, green indicates F-actin. On random fibers, non-treated cells at a) day 1 and b) day 7, and treated cells at e) day 1 and f) day 7. On aligned fibers, non-treated cells at c) day 1 and d) day 7 and treated cells at g) day 1 and h) day 7. 60x objective. Scale bar is 25 μm. The arrows show the cell body orientation along the fibers.

