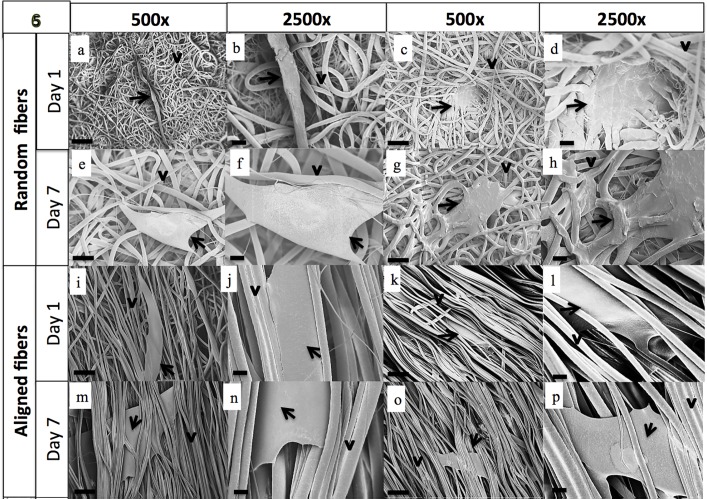
Fig 6. SEM images of MDA-MB-231 cells on fibrous scaffolds after day 1 and day 7 of culture.
The arrows depict the cell body and the arrowheads depict the fibers. Supplemental data showing higher magnification analysis of adhesion and infiltration has been provided in S2 Fig.

