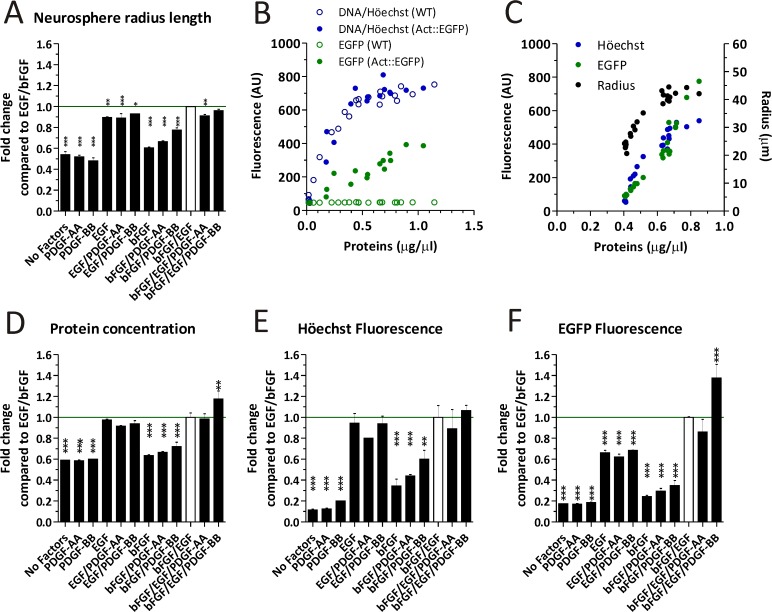
Fig 2. Analying the cell yield by measuring different parameters in Actin::EGFP (A-F) and WT (B) mice NS cultures.
A) The NS radius length was measured under the different experimental conditions. B) Comparison of EGFP and Höechst fluorescence as a function of total proteins in NS cultures derived from WT and Actin::EGFP mice. C) The radius length, DNA content and EGFP fluorescence are expressed as a function of the protein concentration. D-F) Whole NS extracts were analyzed according to the total cell protein concentration (D), DNA content (E) and EGFP fluorescence (F) for different experimental conditions. Data in A, D-F were analyzed with a One-way ANOVA and Dunnet´s post-test, where the EGF/bFGF treatment was established as the control and error bars represent the SD. * = p < 0.05, ** = p < 0.01, *** = p < 0.001.

