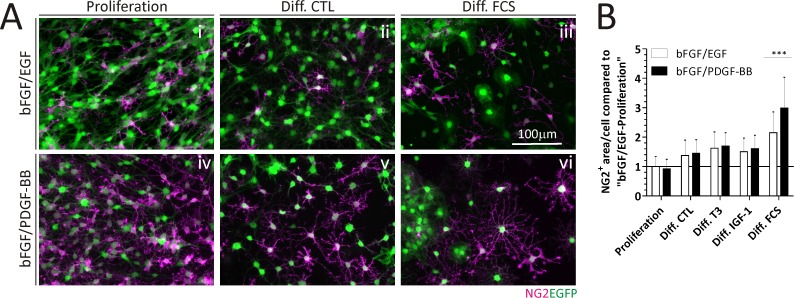
Fig 4. NG2 cells after differentiation in Act::EGFP-derived cultures.
A) Representative ICC of NG2+ cells. B) The NG2+ pixel area per immunopositive cell is quantitated in each culture condition after differentiation. Quantitations were performed by analyzing at least 42 cells on a single cover slip for each treatment. The scale bar in A (iii) equals 100 μm for all images in A. Error bars represent the SD and *** = p < 0,001. Diff.; Differentiation.

