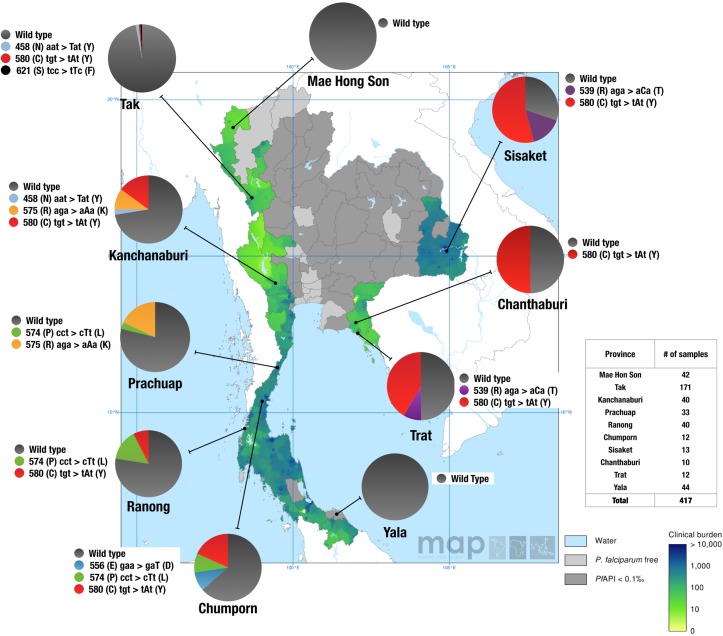
Fig 1. Geographic distribution of the K13 propeller alleles in Thailand in 2007.
Pie charts show K13 propeller allele frequencies among 417 parasite isolates in 10 Thailand provinces. The different alleles are color coded. The results are shown on top of the clinical burden map of P. falciparum in Thailand in 2007 (Malaria Atlas Project) [34]. Light grey areas are P. falciparum malaria free and dark grey areas have an unstable risk of malaria transmission (i.e. annual case incidence, or API, is reported at less than 1 per 10,000). Map shows mean estimate for the clinical burden in the range from 0 (light green) to 10,000 (dark green/blue) clinical cases per year. The clinical burden predictions are based on a Bayesian geostatistical model.

