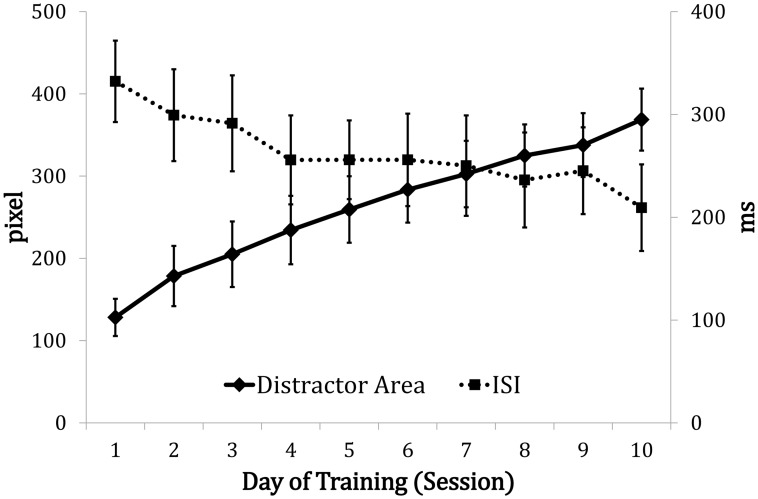
Fig 3. Thresholds (expressed in pixels and in milliseconds, ms) shown in both the filtering and consolidation groups across the ten training sessions.
The distractor areas show the threshold changes in the filtering training, and the ISIs show the threshold changes in the consolidation training. The error bars indicate the standard error of the mean.

