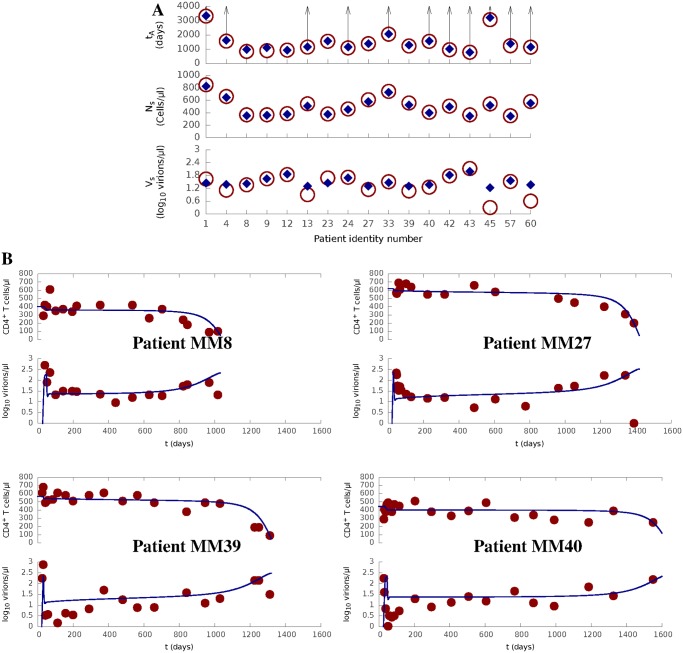
Fig 2. Model prediction for a cohort of treatment-naive HIV-1 patients.
(A) Clinical data (circle and arrow) for all patients under study comparing against model prediction (diamond) for the time to AIDS (t A), the quasi-steady density of CD4+ T cells (N s) and the quasi-steady density of free virions (V s). An arrow represents that t A is greater than a particular value (represented by the connected circle) for a patient as his / her CD4+ count did not reached AIDS level (200 cells/μl) in the data.(B) Prediction (curve) of HIV progression course (N and log 10 V) for four typical patients, where clinical data are shown as dots.Full prediction results are shown in S1 Table and S2 Table.

